
I understand that the reason for the suggested tiering of rares was to try to create a base value for trading up but honestly from reading the various threads I don’t think it will work as you hope.
People have always complained about not understanding tier systems and their labels in higher trading. I can’t imagine the majority of people wanting similar, where they have to look up all the time what constitutes a gold, silver or bronze tier and how to trade between them, for just rares.
I also can’t realistically see people trading their 2014 rare for a 2016 rare without any add on unless it’s what already happens where the person really wants that 2016 or the 2016 is an event pet or more popular species.
What about a system where to move between the years you add an uncommon for each year difference? Or even a very uncommon if people prefer. It’s simple, easy to understand and remember and doesn’t end with an ‘09 rare (that until recently were uncommon) being worth 20+ recent rares.
[🐝] Guide to Trading Every Pet on CS --- **being updated**
Re: [🐝] Guide to Trading Every Pet on CS -* Discussing! *
![]() by lil rascal » Fri Oct 20, 2023 11:34 am
by lil rascal » Fri Oct 20, 2023 11:34 am

-

lil rascal - Posts: 10298
- Joined: Sun Feb 20, 2011 1:19 am
- My pets
- My items
- My wishlist
- My gallery
- My scenes
- My dressups
- Trade with me
Re: [🐝] Guide to Trading Every Pet on CS -* Discussing! *
![]() by SolarSonnet » Fri Oct 20, 2023 4:03 pm
by SolarSonnet » Fri Oct 20, 2023 4:03 pm
The problem is that (from my experience) people don't want to trade their rares for uncommons. Especially if you're in the same boat as me where it takes 8 Uncommons/4 VUC/2 EUC to equal a rare. I'm not doing 1.125 between years before like, 2016.
I did do some math on this post where with one of the methods, 1 2016 r = 1.16 2017 r (or like, 1 Rare, 1 Uncommon, 1 VC, and 1 OMGSC from 2017)
New Method is in Aqua here:
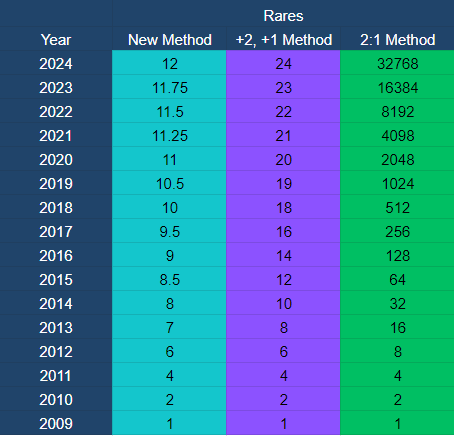
1 09 = 2 2010s (1:2)
2 2010s = 4 2011s (1:2)
4 2011s = 6 2012s (2:3) 2:3 is 1:1.5, which is a rare + euc
6 2012s = 7 2013s (6:7 = 1:1.16, seen above. Maybe round to 1.125 or 1.25, meaning a Rare+ Uncommon or Rare+ VUC)
7 2013s = 8 2014s (7:8 ratio is 1:1.14 - round again same as above)
8 2014s = 8.5 2015s (1:1.05 = R + Common)
8.5 2015s = 9 2016s (1:1.05 = R + Common)
9 2016s = 9.5 2017s (1:1.05 = R + Common)
9.5 2017 = 10 2018 (1:1.05 = R + Common)
10 2018 = 10.5 2019 (1:1.05 = R + Common)
10.5 2019 = 11 2020 (1:1.05 = R + Common)
11 2020 = 11.25 2021 (1:1.02 = R + Very Common)
11.25 2021 = 11.5 2022 (1:1.02 = R + Very Common)
11.5 2022 = 2023 (1:1.02 = R + Very Common)
11.75 2023 = 12 2024 (1:1.02 = R + Very Common)
Doing all of this math actually makes me think that either:
A) 12 2023 rares for an 09 is too little, because of the way it effects the rest of the rarity math.
Or
B: The rarity math is not properly distributed in my chart, and we need to revise.
Using Option A:
I could see, realistically:
09-2011 = 1:2
2011-2013 = 1:1.5 (R + EUC)
2013-2015 = 1:1.25 (R + VUC)
2015-2019 = 1:1.125 (R + UC)
2019-2023 = 1:1.06 (R + C)
Alternatively, if we're really on the 09 and 10 rares being even.
09-10 = 1:1
10-11 = 1:2
A biiig problem with this, though, is how that would 'technically' distribute how much an 09r is worth on a chart.
09-2011 = 1:2
1 09 = 2 10 = 4 11
2011-2013 = 1:1.5 (R + EUC)
4 11 = 6 2012 = 9 2013
2013-2015 = 1:1.25 (R + VUC)
9 2013 = 11.25 2014 = 14 2015
2015-2019 = 1:1.125 (R + UC)
14.06 2015 = 15.82 2016 = 17.79 2017 = 20.02 2019
2019-2023 = 1:1.02 (R + C)
20.02 2019 = 21.22 2022 = 22.49 2023 = 23.84 2023
Which.. oops, suddenly we're back at what is basically the +2+1 method.
Using B:
I don't know how we'd redistribute, my only idea is this (rares only, not VRs) and I'm spitballing with no real research done into this, just what felt 'okay' based on previous suggestions and input.
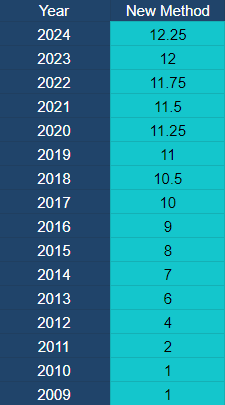
Which would put
09-10 = 1:1
10-12 = 2:1
12-13 = 4:6/2:3 = 1:1.5 (R + EUC)
13-2017 = 6:7 = 1:1.16 (Round up or down depending on year and preference, Rare + VUC or R + UC. Personally for me I'd be 2013-2015 = R + VUC 2015-2017 = R + UC)
2017-2019 = 10:10.5/1:1.05 (R + C)
2019-2024 = 11:11.25/1:1.02 (R + Very Common)
Edits:
Grammar fixes, some clarification, moved around some stuff.
Big Edit:
In option A, I realized that making it 09-10 = 1:1 would actually like, nearly halve the amount of rares it takes. Making the entire chart actually hit the 12-ish 2023 rares for an 09, like the other chart. And then everything feels like it falls together, though I do like my Option B better because the numbers just flow more nicely and the only rounding there is is in the 2013-2017 area.
Re-doing the math on Option A with 1:1 09-10 rares.
09-10 = 1:1
10-2011 = 1:2
2011-2013 = 1:1.5 (R + EUC)
2 11 = 3 12 = 4.5 2013
2013-2015 = 1:1.25 (R + VUC)
4.5 2013 = 5.625 2014 = 7.03 2015
2015-2019 = 1:1.125 (R + UC)
7.03 2015 = 7.91 2016 = 8.89 2017 = 10.01 2018 = 11.26 2019
2019-2023 = 1:1.06 (R + C)
11.26 2019 = 11.9 2020 = 12.64 2021 = 13.4 2022 = 14.20 2023
Which is a little bit over the 12 of the other chart, but does hit around the same area.
I did do some math on this post where with one of the methods, 1 2016 r = 1.16 2017 r (or like, 1 Rare, 1 Uncommon, 1 VC, and 1 OMGSC from 2017)
New Method is in Aqua here:
1 09 = 2 2010s (1:2)
2 2010s = 4 2011s (1:2)
4 2011s = 6 2012s (2:3) 2:3 is 1:1.5, which is a rare + euc
6 2012s = 7 2013s (6:7 = 1:1.16, seen above. Maybe round to 1.125 or 1.25, meaning a Rare+ Uncommon or Rare+ VUC)
7 2013s = 8 2014s (7:8 ratio is 1:1.14 - round again same as above)
8 2014s = 8.5 2015s (1:1.05 = R + Common)
8.5 2015s = 9 2016s (1:1.05 = R + Common)
9 2016s = 9.5 2017s (1:1.05 = R + Common)
9.5 2017 = 10 2018 (1:1.05 = R + Common)
10 2018 = 10.5 2019 (1:1.05 = R + Common)
10.5 2019 = 11 2020 (1:1.05 = R + Common)
11 2020 = 11.25 2021 (1:1.02 = R + Very Common)
11.25 2021 = 11.5 2022 (1:1.02 = R + Very Common)
11.5 2022 = 2023 (1:1.02 = R + Very Common)
11.75 2023 = 12 2024 (1:1.02 = R + Very Common)
Doing all of this math actually makes me think that either:
A) 12 2023 rares for an 09 is too little, because of the way it effects the rest of the rarity math.
Or
B: The rarity math is not properly distributed in my chart, and we need to revise.
Using Option A:
I could see, realistically:
09-2011 = 1:2
2011-2013 = 1:1.5 (R + EUC)
2013-2015 = 1:1.25 (R + VUC)
2015-2019 = 1:1.125 (R + UC)
2019-2023 = 1:1.06 (R + C)
Alternatively, if we're really on the 09 and 10 rares being even.
09-10 = 1:1
10-11 = 1:2
A biiig problem with this, though, is how that would 'technically' distribute how much an 09r is worth on a chart.
09-2011 = 1:2
1 09 = 2 10 = 4 11
2011-2013 = 1:1.5 (R + EUC)
4 11 = 6 2012 = 9 2013
2013-2015 = 1:1.25 (R + VUC)
9 2013 = 11.25 2014 = 14 2015
2015-2019 = 1:1.125 (R + UC)
14.06 2015 = 15.82 2016 = 17.79 2017 = 20.02 2019
2019-2023 = 1:1.02 (R + C)
20.02 2019 = 21.22 2022 = 22.49 2023 = 23.84 2023
Which.. oops, suddenly we're back at what is basically the +2+1 method.
Using B:
I don't know how we'd redistribute, my only idea is this (rares only, not VRs) and I'm spitballing with no real research done into this, just what felt 'okay' based on previous suggestions and input.
Which would put
09-10 = 1:1
10-12 = 2:1
12-13 = 4:6/2:3 = 1:1.5 (R + EUC)
13-2017 = 6:7 = 1:1.16 (Round up or down depending on year and preference, Rare + VUC or R + UC. Personally for me I'd be 2013-2015 = R + VUC 2015-2017 = R + UC)
2017-2019 = 10:10.5/1:1.05 (R + C)
2019-2024 = 11:11.25/1:1.02 (R + Very Common)
Edits:
Grammar fixes, some clarification, moved around some stuff.
Big Edit:
In option A, I realized that making it 09-10 = 1:1 would actually like, nearly halve the amount of rares it takes. Making the entire chart actually hit the 12-ish 2023 rares for an 09, like the other chart. And then everything feels like it falls together, though I do like my Option B better because the numbers just flow more nicely and the only rounding there is is in the 2013-2017 area.
Re-doing the math on Option A with 1:1 09-10 rares.
09-10 = 1:1
10-2011 = 1:2
2011-2013 = 1:1.5 (R + EUC)
2 11 = 3 12 = 4.5 2013
2013-2015 = 1:1.25 (R + VUC)
4.5 2013 = 5.625 2014 = 7.03 2015
2015-2019 = 1:1.125 (R + UC)
7.03 2015 = 7.91 2016 = 8.89 2017 = 10.01 2018 = 11.26 2019
2019-2023 = 1:1.06 (R + C)
11.26 2019 = 11.9 2020 = 12.64 2021 = 13.4 2022 = 14.20 2023
Which is a little bit over the 12 of the other chart, but does hit around the same area.


-

SolarSonnet - Posts: 1691
- Joined: Mon Oct 19, 2015 7:34 am
- My pets
- My items
- My wishlist
- My gallery
- My scenes
- My dressups
- Trade with me
Re: [🐝] Guide to Trading Every Pet on CS -* Discussing! *
![]() by Clayflower. » Fri Oct 27, 2023 5:37 am
by Clayflower. » Fri Oct 27, 2023 5:37 am
hi hi, I'm wondering what people have adapted to value ".5 MA", "1 MA", ".5 non", ".75 non" and "1 non" currently? Sorry if this isn't the right place to ask! If so, do let me know where I can post this question :)
I found this:
It's from almost exactly a year ago and is familiar to me.
I have my own approximate values that I've been using, but I've been doing larger trades and would like to make sure I'm as accurate as possible. When the community is evaluating ".5 MA" or ".75 non" do they still use the term '09 rare? I've seen it around but not as much. What happens if the '09 rare is VR or ER? Does it count for 2, like the 2:1 ratio? If something like a Zebra is worth ".75 non", how do I calculate the remaining .25?
I know things are changing and being discussed, but it seems like this is what people are using now. Any help is appreciated!
I found this:
A general guide commonly seen in pet worth threads now breaks the terms down as:
1 non = 2 sorbs = 10-12 mid-advents (MAs) = 100-150 '09 rares
1 sorb = 0.5 nons = 5-6 MAs
1 MA = 7-8 '09 rares
It's from almost exactly a year ago and is familiar to me.
I have my own approximate values that I've been using, but I've been doing larger trades and would like to make sure I'm as accurate as possible. When the community is evaluating ".5 MA" or ".75 non" do they still use the term '09 rare? I've seen it around but not as much. What happens if the '09 rare is VR or ER? Does it count for 2, like the 2:1 ratio? If something like a Zebra is worth ".75 non", how do I calculate the remaining .25?
I know things are changing and being discussed, but it seems like this is what people are using now. Any help is appreciated!
₊˚ ✧ ━━━━⊱⋆⊰━━━━ ✧ ₊˚₊˚ ✧ ━━━━⊱⋆⊰━━━━ ✧₊˚ ✧ ━━━━⊱⋆⊰━━━━ ✧ ₊˚₊˚ ✧ ━━━━⊱⋆⊰━━━━ ✧₊˚ ✧ ━━━━⊱⋆⊰━━━━ ✧ ₊˚₊˚ ✧ ━━━━⊱⋆⊰━━━━ ✧✧ ₊˚₊˚


♡ my uma hub (wip)
♡ DC - Clayflower
♡ M • 2/13/2022
♡₣ɆɆĐ ₮ⱧɆ ₩ØⱠVɆ₴
♡ says "dude" too much
♡ pfp & anim done by hookfang
♡ DC - Clayflower
♡ M • 2/13/2022
♡₣ɆɆĐ ₮ⱧɆ ₩ØⱠVɆ₴
♡ says "dude" too much
♡ pfp & anim done by hookfang
-

Clayflower. - Posts: 28368
- Joined: Sun Mar 12, 2017 7:28 am
- My pets
- My items
- My wishlist
- My gallery
- My scenes
- My dressups
- Trade with me
Re: [🐝] Guide to Trading Every Pet on CS -* Discussing! *
![]() by SolarSonnet » Fri Oct 27, 2023 9:43 am
by SolarSonnet » Fri Oct 27, 2023 9:43 am
Clayflower. wrote:hi hi, I'm wondering what people have adapted to value ".5 MA", "1 MA", ".5 non", ".75 non" and "1 non" currently? Sorry if this isn't the right place to ask! If so, do let me know where I can post this question
I found this:A general guide commonly seen in pet worth threads now breaks the terms down as:
1 non = 2 sorbs = 10-12 mid-advents (MAs) = 100-150 '09 rares
1 sorb = 0.5 nons = 5-6 MAs
1 MA = 7-8 '09 rares
It's from almost exactly a year ago and is familiar to me.
I have my own approximate values that I've been using, but I've been doing larger trades and would like to make sure I'm as accurate as possible. When the community is evaluating ".5 MA" or ".75 non" do they still use the term '09 rare? I've seen it around but not as much. What happens if the '09 rare is VR or ER? Does it count for 2, like the 2:1 ratio? If something like a Zebra is worth ".75 non", how do I calculate the remaining .25?
I know things are changing and being discussed, but it seems like this is what people are using now. Any help is appreciated!
Currently we're working on revamping things, but it seems like people are still using older valuations until a new guide is put out/decided on.
We may be moving away from 09 Rares in favor for either 2010-2011 rares, or 2011-2012 rares. (Im not sure which).
Also, the value of a non seems to be going down, whereas they were 100-150 09 rares before, most talk has been of them being worth 50 "Old Rares" (which is either 2010-2011 or 2011-2012 or somewhere in between. I think some wanted to use 2009-2010 but I don't personally subscribe to that one.)
We also have been trending towards eliminating the terms of "MA" and "Non" as the new system (whatever it is) likely won't have those as names for the tiers.
xxxxxxxxxxxxx
I'm also working on spreading the word about my thread, I have a banner link in my signature, but here is one as well:
Discuss and Vote on New Trading Guidelines
here!

Where we want everyone's opinions on our google form and polling, even if they don't partake in the actual discussion. We are also actively looking for more people to discuss on the thread itself. The more involved the community is with figuring out new trading guidelines, the fairer we can make trading as a whole.
-
SolarSonnet - Posts: 1691
- Joined: Mon Oct 19, 2015 7:34 am
- My pets
- My items
- My wishlist
- My gallery
- My scenes
- My dressups
- Trade with me
Re: [🐝] Guide to Trading Every Pet on CS -* Discussing! *
![]() by Clayflower. » Fri Oct 27, 2023 11:00 am
by Clayflower. » Fri Oct 27, 2023 11:00 am
SolarSonnet wrote:Clayflower. wrote:hi hi, I'm wondering what people have adapted to value ".5 MA", "1 MA", ".5 non", ".75 non" and "1 non" currently? Sorry if this isn't the right place to ask! If so, do let me know where I can post this question
I found this:A general guide commonly seen in pet worth threads now breaks the terms down as:
1 non = 2 sorbs = 10-12 mid-advents (MAs) = 100-150 '09 rares
1 sorb = 0.5 nons = 5-6 MAs
1 MA = 7-8 '09 rares
It's from almost exactly a year ago and is familiar to me.
I have my own approximate values that I've been using, but I've been doing larger trades and would like to make sure I'm as accurate as possible. When the community is evaluating ".5 MA" or ".75 non" do they still use the term '09 rare? I've seen it around but not as much. What happens if the '09 rare is VR or ER? Does it count for 2, like the 2:1 ratio? If something like a Zebra is worth ".75 non", how do I calculate the remaining .25?
I know things are changing and being discussed, but it seems like this is what people are using now. Any help is appreciated!
Currently we're working on revamping things, but it seems like people are still using older valuations until a new guide is put out/decided on.
We may be moving away from 09 Rares in favor for either 2010-2011 rares, or 2011-2012 rares. (Im not sure which).
Also, the value of a non seems to be going down, whereas they were 100-150 09 rares before, most talk has been of them being worth 50 "Old Rares" (which is either 2010-2011 or 2011-2012 or somewhere in between. I think some wanted to use 2009-2010 but I don't personally subscribe to that one.)
We also have been trending towards eliminating the terms of "MA" and "Non" as the new system (whatever it is) likely won't have those as names for the tiers.
xxxxxxxxxxxxx
I'm also working on spreading the word about my thread, I have a banner link in my signature, but here is one as well:
Discuss and Vote on New Trading Guidelines
here!
Where we want everyone's opinions on our google form and polling, even if they don't partake in the actual discussion. We are also actively looking for more people to discuss on the thread itself. The more involved the community is with figuring out new trading guidelines, the fairer we can make trading as a whole.
I see! I don't mind having a non as a form of measurement, just as long as it changes to reflect values that are changing.
It seems you're right as well. I've been doing some research and found the average values from what I've listed above are somewhat incorrect -- which was to be expected:
1 non: ~10 MA
.75 non: ~7 MA
.5 non : ~ 5 MA
.25 non: ~ 2-3 MA
1 MA: 6-9 09's
.75 MA: 5-6 09's
.5 MA: 3-4 09's
So the nons do seem to have decreased in value which I don't mind!
I would love to see a shift of '10 and '11 rares being used instead of '09! 2009 rares, in my opinion at least, are starting to become too old, and inaccessible especially for newer players looking to start trading. Rares from '10 and '11 will become just as popular as time moves foward, at least I hope!
I do understand that old pets will most likely be wanted for old pets as well; just how value works in general. However I love the idea CS has with the poll mentioning more rare pets in monthly adopts.
I'll check out the thread and hopefully be able to contribute!
₊˚ ✧ ━━━━⊱⋆⊰━━━━ ✧ ₊˚₊˚ ✧ ━━━━⊱⋆⊰━━━━ ✧₊˚ ✧ ━━━━⊱⋆⊰━━━━ ✧ ₊˚₊˚ ✧ ━━━━⊱⋆⊰━━━━ ✧₊˚ ✧ ━━━━⊱⋆⊰━━━━ ✧ ₊˚₊˚ ✧ ━━━━⊱⋆⊰━━━━ ✧✧ ₊˚₊˚
♡ my uma hub (wip)
♡ DC - Clayflower
♡ M • 2/13/2022
♡₣ɆɆĐ ₮ⱧɆ ₩ØⱠVɆ₴
♡ says "dude" too much
♡ pfp & anim done by hookfang
♡ DC - Clayflower
♡ M • 2/13/2022
♡₣ɆɆĐ ₮ⱧɆ ₩ØⱠVɆ₴
♡ says "dude" too much
♡ pfp & anim done by hookfang
-
Clayflower. - Posts: 28368
- Joined: Sun Mar 12, 2017 7:28 am
- My pets
- My items
- My wishlist
- My gallery
- My scenes
- My dressups
- Trade with me
Re: [🐝] Guide to Trading Every Pet on CS -* Discussing! *
![]() by BlueEyedKite » Sat Oct 28, 2023 2:02 am
by BlueEyedKite » Sat Oct 28, 2023 2:02 am
Hey Horror, this Q is for you. When I came along your guide was already a thing, so my question is, how did you come up with your guide? Was it only yourself? You and specific users? What high value traders were trading already you just wrote it out?


-

BlueEyedKite - Posts: 11780
- Joined: Thu May 28, 2009 9:38 am
- My pets
- My items
- My wishlist
- My gallery
- My scenes
- My dressups
- Trade with me
Re: [🐝] Guide to Trading Every Pet on CS -* Discussing! *
![]() by Horror » Sat Oct 28, 2023 9:11 am
by Horror » Sat Oct 28, 2023 9:11 am
BlueEyedKite wrote:Hey Horror, this Q is for you. When I came along your guide was already a thing, so my question is, how did you come up with your guide? Was it only yourself? You and specific users? What high value traders were trading already you just wrote it out?
Happy to answer! I stepped back from giving advice for a while to see how things turn out after the og list. After almost 2 years it was still the same "here's the fairness (obligatory 'if you still use the list') and here's the fairness if you just take pets at face value", and I wanted to try helping out again, but it didn't seem like people thought that system was helpful
So I wanted to try a compromise by using a list format everyone's familiar with, but placing pets by rarity instead of personal opinion, and just highlighting the pets with demand so it's actually useful for trading. I got the info from rarity changes and people's trade data, and at the time the values from the 1 non = 100 rares discussion were the most commonly used, so I based things off that as well. It took 2 or 3 nights to put together, proposed the draft in a cs discord server to see if people think it's a good idea, then posted it. Then last year I expanded the thread to include all pets and not only lists
I pretty much just compiled info into one thread myself but based off what the majority of the community used, and including my sources so people could be confident I don't just make things up. I hope that's a good enough answer
I haven't had time to really get into the discussion recently so I've only been skimming posts, but I'm glad people are still working things out! I'm excited to see the community come together for this again
xxxĮ̵̨̧̡̡̡̡̧̡̧̢̡̡̨̨̢̨̡̨̡̢̡̢̢̛̛̛̛̛̛̛̛̛͎̠̺̦͕̯̯̻͉̱͎̠̣̼̫̳̤̦̯̣̯̼̠̱͈̙̫̘̼̜̳͔̭̗̱̯̝̗̼̞̮̺̻̥͉̦̻͕̱͉̘̝̲̯̗̟͇̻̫̫̼̠͙̤͔̪̫̟͖̩͚͉͈̺̺͔̥͈̯̪͚̱͔̹̺͇̩̣̙͎͉̝̞̫̪̘͕͕̰̥̼̙̻͕͔͖̳̺̙̳̙̤̬̱͇͈̦̦̼̯̮͙̼͎̫̜͈̤̮̣̲̣̠̠̻̫͓̼͎̹̣͓̰̩̤͈̰̝̟̭͇͕̰̮͖̩̗͇͈̻͖͇͓̮̦̘̼̘͓̱̖̫̥̳͈̦͇͖̬͔̙͖̠̜̹̤̹̰͕̹̥̪̟̯͖͉̘̜̹̦̪̲̹͕̙̫̘͓̦̝̘̫̟̖̥̬̫̞͚̺̱͚̯̗̩̮̠̲̘͕͙̘̙̪͖͚̼͈̞̱̣̞̭̝̟̌̊͐̌̿̋̈̔̒̈́̾́̓̈́́͐̆̓̾́̇̃͊̓̆͋̿͑̌͊́͊͋̋͊̌̂̇͑̑̽͂̏̈́̀͋̂̈́̈́̀͂̅̑̔͑̉̃̓͗͛̓̋̽̀̒̿̈́̋̆̾̃̿̿̂̀̃̒̆̓̐̀͗̏͊̈́̈̀͒̇̄͋̏̒̊̽̓̍̑͐́̽̐͒̅̎́́̈̃̎͋̅̅̉̾́́̀̄̌̌́͛̽͛͋͐͒̔̈́̉̅̑͒̐͗̍̌͐̈́̏̆̈́̄͌̒̈͑͑̉̒͐̆̓̇͌̐̌̃̐̒͆̈́͑̑͊̈͋͗̽́̒̽̀̔̀̈̀̓̽̏̊͑̽̋̃͊́̀̓̏̌̓̈́̒̅̃̍̏̇̍̽̊̈̊̎̆̉̂̃̉̃̏̎͆̈̏̃̂͂̈́̉̽̃͛̋̈́͂̕̚͘̕̕͘̕͘͘̚̕̕͘̕͘̚̚͜͜͜͝͝͝͝͝͠͠͝͝͝͝͠͝͝͠͝͝ͅͅͅ
/̷͉̥̒̈̊̅̓̃̾̈̇́\̴̨̨̜̺̝̦̠̓͘\̴̨̨̜̺̝̦̠̓͘
x /̷͉̥̒̈̊̅̓̃̾̈̇́Ỉ̴̧̢̡̛͙̩͙̗͙̳̤̣̞͉̦̬͍̦͖̣̠̪̺̖̩̭̳̻̗͕̺̮̞̝̳̥͉͕̮͕̦̪͈̯͔͚̳͎̔̋͂̌̂͐͊̉̐͜͜͜͝ͅ
/̷͉̥̒̈̊̅̓̃̾̈̇́\̴̨̨̜̺̝̦̠̓͘
i-̵̡͙̦̮̃̚
Ỉ̴̧̢̡̛͙̩͙̗͙̳̤̣̞͉̦̬͍̦͖̣̠̪̺̖̩̭̳̻̗͕̺̮̞̝̳̥͉͕̮͕̦̪͈̯͔͚̳͎̔̋͂̌̂͐͊̉̐͜͜͜͝ͅxxxxxxxx/̷͉̥̒̈̊̅̓̃̾̈̇́\̴̨̨̜̺̝̦̠̓͘xx\̸̢̡̡̞͙̪̟̦͈͍̟͎̹͈̻͈̞̣͕̙̥̗͕͙̱͙͉̳͙̘͇̼̻͈̱̙̗̱͓̰̗͎̇͒́̆͠xxxxxxx.̸̧̧̢̡̢̧̧̧̧̢̣͉̠͙̮̳͓̭̖͙̟̺͉͚̳̲͇̜͖̤̖͈̺͎̠̜̹̱̭̩̼̜̻̪̤̫͚̩͕̩͖̠̘̙͍͇͍̫͔̜̳͓̼͖͇̮͕͍̤̠̣͉̭̣̻͉̦̭͙̩͔͎̱̖̇́̐̋̐͛̀̀̾́͜͜͜͜͜͜͜ͅͅͅ *̶̢̣̙̳͕̐̐̿̌ixxxxỈ̴̧̢̡̛͙̩͙̗͙̳̤̣̞͉̦̬͍̦͖̣̠̪̺̖̩̭̳̻̗͕̺̮̞̝̳̥͉͕̮͕̦̪͈̯͔͚̳͎̔̋͂̌̂͐͊̉̐͜͜͜͝ͅ
x危险危险危险危险危险危险危险危险危险 ┓\̴̨̨̜̺̝̦̠̓͘/̷͉̥̒̈̊̅̓̃̾̈̇́\̸̢̡̡̞͙̪̟̦͈͍̟͎̹͈̻͈̞̣͕̙̥̗͕͙̱͙͉̳͙̘͇̼̻͈̱̙̗̱͓̰̗͎̇͒́̆͠
 \̴̨̨̜̺̝̦̠̓͘/̷͉̥̒̈̊̅̓̃̾̈̇́ Ỉ̴̧̢̡̛͙̩͙̗͙̳̤̣̞͉̦̬͍̦͖̣̠̪̺̖̩̭̳̻̗͕̺̮̞̝̳̥͉͕̮͕̦̪͈̯͔͚̳͎̔̋͂̌̂͐͊̉̐͜͜͜͝ͅ
┗ixx紧急紧急紧急紧急 \̴̨̨̜̺̝̦̠̓͘ Į̵̨̧̡̡̡̡̧̡̧̢̡̡̨̨̢̨̛̛̛̛̛̛̛̛̛͎̠̺̦͕̯̯̻͉̱͎̠̣̼̫̳̤̦̯̣̯̼̠̱͈̙̫̘̼̜̳͔̭̗̱̯̝̗̼̞̮̺̻̥͉̦̻͕̱͉̘̝̲̯̗̟͇̻̫̫̼̠͙̤͔̪̫̟͖̩͚͉͈̺̺͔̥͈̯̪͚̱͔̹̺͇̩̣̙͎͉̝̞̫̪̘͕͕̰̥̼̙̻͕͔͖̳̺̙̳̙̤̬̱͇͈̦̦̼̯̮͙̼͎̫̜͈̤̮̣̲̣̠̠̻̫͓̼͎̹̣͓̰̩̤͈̰̝̟̭͇͕̰̮͖̩̗͇͈̻͖͇͓̮̦̘̼̘͓̱̖̫̥̳͈̦͇͖̬͔̙͖̠̜̹̤̹̰͕̹̥̪̟̯͖͉̘̜̹̦̪̌̊͐̌̿̋̈̔̒̈́̾́̓̈́́͐̆̓̾́̇̃͊̓̆͋̿͑̌͊́͊͋̋͊̌̂̇͑̑̽͂̏̈́̀͋̂̈́̈́̀͂̅̑̔͑̉̃̓͗͛̓̋̽̀̒̿̈́̋̆̾̃̿̿̂̀̃̒̆̓̐̀͗̏͊̈́̈̀͒̇̄͋̏̒̊̽̓̍̑͐́̽̐͒̅̎́́̈̃̎͋̅̅̉̾́́̀̄̌̌́͛̽͛͋͐͒̔̈́̉̅̑͒̐͗̍̌͐̈́̏̆̈́̄͌̒̈͑͑̉̒͐̆̓̇͌̐̌̃̐̒͆̈́͑̑͊̈͋͗̽́̒̽̀̔̀̈̀̓̽̏̊͑̽̋̃͊́̀̓̏̌̓̈́̒̅̃̍̏̇̍̽̊̈̊̎̆̉̂̃̉̃̏̎͆̈̏̃̂͂̈́̉̽̃͛̋̈́͂̕̚͘̕̕͘̕͘͘̚̕̕͘̕͘̚̚͜͜͜͝͝͝͝͝͠͠͝͝͝͝͠͝͝͠͝͝ͅͅͅ
Į̵̨̧̡̡̡̡̧̡̧̢̡̡̨̨̢̨̡̨̡̢̡̢̢̛̛̛̛̛̛̛̛̛͎̠̺̦͕̯̯̻͉̱͎̠̣̼̫̳̤̦̯̣̯̼̠̱͈̙̫̘̼̜̳͔̭̗̱̯̝̗̼̞̮̺̻̥͉̦̻͕̱͉̘̝̲̯̗̟͇̻̫̫̼̠͙̤͔̪̫̟͖̩͚͉͈̺̺͔̥͈̯̪͚̱͔̹̺͇̩̣̙͎͉̝̞̫̪̘͕͕̰̥̼̙̻͕͔͖̳̺̙̳̙̤̬̱͇͈̦̦̼̯̮͙̼͎̫̜͈̤̮̣̲̣̠̠̻̫͓̼͎̹̣͓̰̩̤͈̰̝̟̭͇͕̰̮͖̩̗͇͈̻͖͇͓̮̦̘̼̘͓̱̖̫̥̳͈̦͇͖̬͔̙͖̠̜̹̤̹̰͕̹̥̪̟̯͖͉̘̜̹̦̪̲̹͕̙̫̘͓̦̝̘̫̟̖̥̬̫̞͚̺̱͚̯̗̩̮̠̲̘͕͙̘̙̪͖͚̼͈̞̱̣̞̭̝̟̌̊͐̌̿̋̈̔̒̈́̾́̓̈́́͐̆̓̾́̇̃͊̓̆͋̿͑̌͊́͊͋̋͊̌̂̇͑̑̽͂̏̈́̀͋̂̈́̈́̀͂̅̑̔͑̉̃̓͗͛̓̋̽̀̒̿̈́̋̆̾̃̿̿̂̀̃̒̆̓̐̀͗̏͊̈́̈̀͒̇̄͋̏̒̊̽̓̍̑͐́̽̐͒̅̎́́̈̃̎͋̅̅̉̾́́̀̄̌̌́͛̽͛͋͐͒̔̈́̉̅̑͒̐͗̍̌͐̈́̏̆̈́̄͌̒̈͑͑̉̒͐̆̓̇͌̐̌̃̐̒͆̈́͑̑͊̈͋͗̽́̒̽̀̔̀̈̀̓̽̏̊͑̽̋̃͊́̀̓̏̌̓̈́̒̅̃̍̏̇̍̽̊̈̊̎̆̉̂̃̉̃̏̎͆̈̏̃̂͂̈́̉̽̃͛̋̈́͂̕̚͘̕̕͘̕͘͘̚̕̕͘̕͘̚̚͜͜͜͝͝͝͝͝͠͠͝͝͝͝͠͝͝͠͝͝ͅͅͅĮ̵̨̧̡̡̡̡̧̡̧̢̡̡̨̨̢̨̡̨̡̢̡̢̢̛̛̛̛̛̛̛̛̛͎̠̺̦͕̯̯̻͉̱͎̠̣̼̫̳̤̦̯̣̯̼̠̱͈̙̫̘̼̜̳͔̭̗̱̯̝̗̼̞̮̺̻̥͉̦̻͕̱͉̘̝̲̯̗̟͇̻̫̫̼̠͙̤͔̪̫̟͖̩͚͉͈̺̺͔̥͈̯̪͚̱͔̹̺͇̩̣̙͎͉̝̞̫̪̘͕͕̰̥̼̙̻͕͔͖̳̺̙̳̙̤̬̱͇͈̦̦̼̯̮͙̼͎̫̜͈̤̮̣̲̣̠̠̻̫͓̼͎̹̣͓̰̩̤͈̰̝̟̭͇͕̰̮͖̩̗͇͈̻͖͇͓̮̦̘̼̘͓̱̖̫̥̳͈̦͇͖̬͔̙͖̠̜̹̤̹̰͕̹̥̪̟̯͖͉̘̜̹̦̪̲̹͕̙̫̘͓̦̝̘̫̟̖̥̬̫̞͚̺̱͚̯̗̩̮̠̲̘͕͙̘̙̪͖͚̼͈̞̱̣̞̭̝̟̌̊͐̌̿̋̈̔̒̈́̾́̓̈́́͐̆̓̾́̇̃͊̓̆͋̿͑̌͊́͊͋̋͊̌̂̇͑̑̽͂̏̈́̀͋̂̈́̈́̀͂̅̑̔͑̉̃̓͗͛̓̋̽̀̒̿̈́̋̆̾̃̿̿̂̀̃̒̆̓̐̀͗̏͊̈́̈̀͒̇̄͋̏̒̊̽̓̍̑͐́̽̐͒̅̎́́̈̃̎͋̅̅̉̾́́̀̄̌̌́͛̽͛͋͐͒̔̈́̉̅̑͒̐͗̍̌͐̈́̏̆̈́̄͌̒̈͑͑̉̒͐̆̓̇͌̐̌̃̐̒͆̈́͑̑͊̈͋͗̽́̒̽̀̔̀̈̀̓̽̏̊͑̽̋̃͊́̀̓̏̌̓̈́̒̅̃̍̏̇̍̽̊̈̊̎̆̉̂̃̉̃̏̎͆̈̏̃̂͂̈́̉̽̃͛̋̈́͂̕̚͘̕̕͘̕͘͘̚̕̕͘̕͘̚̚͜͜͜͝͝͝͝͝͠͠͝͝͝͝͠͝͝͠͝͝ͅͅͅxxxxnĮ̵̨̧̡̡̡̡̧̡̧̢̡̡̨̨̢̨̡̨̡̢̡̢̢̛̛̛̛̛̛̛̛̛͎̠̺̦͕̯̯̻͉̱͎̠̣̼̫̳̤̦̯̣̯̼̠̱͈̙̫̘̼̜̳͔̭̗̱̯̝̗̼̞̮̺̻̥͉̦̻͕̱͉̘̝̲̯̗̟͇̻̫̫̼̠͙̤͔̪̫̟͖̩͚͉͈̺̺͔̥͈̯̪͚̱͔̹̺͇̩̣̙͎͉̝̞̫̪̘͕͕̰̥̼̙̻͕͔͖̳̺̙̳̙̤̬̱͇͈̦̦̼̯̮͙̼͎̫̜͈̤̮̣̲̣̠̠̻̫͓̼͎̹̣͓̰̩̤͈̰̝̟̭͇͕̰̮͖̩̗͇͈̻͖͇͓̮̦̘̼̘͓̱̖̫̥̳͈̦͇͖̬͔̙͖̠̜̹̤̹̰͕̹̥̪̟̯͖͉̘̜̹̦̪̲̹͕̙̫̘͓̦̝̘̫̟̖̥̬̫̞͚̺̱͚̯̗̩̮̠̲̘͕͙̘̙̪͖͚̼͈̞̱̣̞̭̝̟̌̊͐̌̿̋̈̔̒̈́̾́̓̈́́͐̆̓̾́̇̃͊̓̆͋̿͑̌͊́͊͋̋͊̌̂̇͑̑̽͂̏̈́̀͋̂̈́̈́̀͂̅̑̔͑̉̃̓͗͛̓̋̽̀̒̿̈́̋̆̾̃̿̿̂̀̃̒̆̓̐̀͗̏͊̈́̈̀͒̇̄͋̏̒̊̽̓̍̑͐́̽̐͒̅̎́́̈̃̎͋̅̅̉̾́́̀̄̌̌́͛̽͛͋͐͒̔̈́̉̅̑͒̐͗̍̌͐̈́̏̆̈́̄͌̒̈͑͑̉̒͐̆̓̇͌̐̌̃̐̒͆̈́͑̑͊̈͋͗̽́̒̽̀̔̀̈̀̓̽̏̊͑̽̋̃͊́̀̓̏̌̓̈́̒̅̃̍̏̇̍̽̊̈̊̎̆̉̂̃̉̃̏̎͆̈̏̃̂͂̈́̉̽̃͛̋̈́͂̕̚͘̕̕͘̕͘͘̚̕̕͘̕͘̚̚͜͜͜͝͝͝͝͝͠͠͝͝͝͝͠͝͝͠͝͝ͅͅͅĮ̵̨̧̡̡̡̡̧̡̧̢̡̡̨̨̢̨̡̨̡̢̡̢̢̛̛̛̛̛̛̛̛̛͎̠̺̦͕̯̯̻͉̱͎̠̣̼̫̳̤̦̯̣̯̼̠̱͈̙̫̘̼̜̳͔̭̗̱̯̝̗̼̞̮̺̻̥͉̦̻͕̱͉̘̝̲̯̗̟͇̻̫̫̼̠͙̤͔̪̫̟͖̩͚͉͈̺̺͔̥͈̯̪͚̱͔̹̺͇̩̣̙͎͉̝̞̫̪̘͕͕̰̥̼̙̻͕͔͖̳̺̙̳̙̤̬̱͇͈̦̦̼̯̮͙̼͎̫̜͈̤̮̣̲̣̠̠̻̫͓̼͎̹̣͓̰̩̤͈̰̝̟̭͇͕̰̮͖̩̗͇͈̻͖͇͓̮̦̘̼̘͓̱̖̫̥̳͈̦͇͖̬͔̙͖̠̜̹̤̹̰͕̹̥̪̟̯͖͉̘̜̹̦̪̲̹͕̙̫̘͓̦̝̘̫̟̖̥̬̫̞͚̺̱͚̯̗̩̮̠̲̘͕͙̘̙̪͖͚̼͈̞̱̣̞̭̝̟̌̊͐̌̿̋̈̔̒̈́̾́̓̈́́͐̆̓̾́̇̃͊̓̆͋̿͑̌͊́͊͋̋͊̌̂̇͑̑̽͂̏̈́̀͋̂̈́̈́̀͂̅̑̔͑̉̃̓͗͛̓̋̽̀̒̿̈́̋̆̾̃̿̿̂̀̃̒̆̓̐̀͗̏͊̈́̈̀͒̇̄͋̏̒̊̽̓̍̑͐́̽̐͒̅̎́́̈̃̎͋̅̅̉̾́́̀̄̌̌́͛̽͛͋͐͒̔̈́̉̅̑͒̐͗̍̌͐̈́̏̆̈́̄͌̒̈͑͑̉̒͐̆̓̇͌̐̌̃̐̒͆̈́͑̑͊̈͋͗̽́̒̽̀̔̀̈̀̓̽̏̊͑̽̋̃͊́̀̓̏̌̓̈́̒̅̃̍̏̇̍̽̊̈̊̎̆̉̂̃̉̃̏̎͆̈̏̃̂͂̈́̉̽̃͛̋̈́͂̕̚͘̕̕͘̕͘͘̚̕̕͘̕͘̚̚͜͜͜͝͝͝͝͝͠͠͝͝͝͝͠͝͝͠͝͝ͅͅͅĮ̵̧̢̡̡̧̡̛̛̪͖̖̣̥̟͓̣̲̗̬̰̼̤̹͙̙̥̺͚͇̗̳̣̙̯̮̝̥̲̹͍͙̮̞̤̟̭̪͈̻̬̞̖͚͖͉̤͉͇͖̯̭̪̩̩̻̳̤̮̳̻͔̦̦͚̒͆̍͌̈̽̊͋̅̽̽̈́͂́̈́̃̀̔͌̍̉̏̇͂̈́͐̃̓́̉̎̌̓́̌̃͌͗́̑͗̄͋͒̋͊̿̊̊̅̕͝͠͠͝͠͠͠ͅͅĮ̵̧̢̡̡̧̡̛̛̪͖̖̣̥̟͓̣̲̗̬̰̼̤̹͙̙̥̺͚͇̗̳̣̙̯̮̝̥̲̹͍͙̮̞̤̟̭̪͈̻̬̞̖͚͖͉̤͉͇͖̯̭̪̩̩̻̳̤̮̳̻͔̦̦͚̒͆̍͌̈̽̊͋̅̽̽̈́͂́̈́̃̀̔͌̍̉̏̇͂̈́͐̃̓́̉̎̌̓́̌̃͌͗́̑͗̄͋͒̋͊̿̊̊̅̕͝͠͠͝͠͠͠ͅͅĮ̵̨̧̡̡̡̡̧̡̧̢̡̡̨̨̢̨̛̛̛̛̛̛̛̛̛͎̠̺̦͕̯̯̻͉̱͎̠̣̼̫̳̤̦̯̣̯̼̠̱͈̙̫̘̼̜̳͔̭̗̱̯̝̗̼̞̮̺̻̥͉̦̻͕̱͉̘̝̲̯̗̟͇̻̫̫̼̠͙̤͔̪̫̟͖̩͚͉͈̺̺͔̥͈̯̪͚̱͔̹̺͇̩̣̙͎͉̝̞̫̪̘͕͕̰̥̼̙̻͕͔͖̳̺̙̳̙̤̬̱͇͈̦̦̼̯̮͙̼͎̫̜͈̤̮̣̲̣̠̠̻̫͓̼͎̹̣͓̰̩̤͈̰̝̟̭͇͕̰̮͖̩̗͇͈̻͖͇͓̮̦̘̼̘͓̱̖̫̥̳͈̦͇͖̬͔̙͖̠̜̹̤̹̰͕̹̥̪̟̯͖͉̘̜̹̦̪̌̊͐̌̿̋̈̔̒̈́̾́̓̈́́͐̆̓̾́̇̃͊̓̆͋̿͑̌͊́͊͋̋͊̌̂̇͑̑̽͂̏̈́̀͋̂̈́̈́̀͂̅̑̔͑̉̃̓͗͛̓̋̽̀̒̿̈́̋̆̾̃̿̿̂̀̃̒̆̓̐̀͗̏͊̈́̈̀͒̇̄͋̏̒̊̽̓̍̑͐́̽̐͒̅̎́́̈̃̎͋̅̅̉̾́́̀̄̌̌́͛̽͛͋͐͒̔̈́̉̅̑͒̐͗̍̌͐̈́̏̆̈́̄͌̒̈͑͑̉̒͐̆̓̇͌̐̌̃̐̒͆̈́͑̑͊̈͋͗̽́̒̽̀̔̀̈̀̓̽̏̊͑̽̋̃͊́̀̓̏̌̓̈́̒̅̃̍̏̇̍̽̊̈̊̎̆̉̂̃̉̃̏̎͆̈̏̃̂͂̈́̉̽̃͛̋̈́͂̕̚͘̕̕͘̕͘͘̚̕̕͘̕͘̚̚͜͜͜͝͝͝͝͝͠͠͝͝͝͝͠͝͝͠͝͝ͅͅͅxxxcxxỈ̶̡̢̛̛̛̜̞̗̜͈͖̤̮̰̫͙͚̙͈͎̼͚͍͍̺̦̯̱̟̫̭͕̭͉͉̃̈́͂̾̎̌̒͊̀̄̍̈̽̓̽̂̌͐̈́͒̆͌̈́͂̐̐̎́̑͛̍͛̐̋͛̌̋̃̄̂͗̈̉͋̏̽̚̚̚͝xxxixxĮ̵̨̧̡̡̡̡̧̡̧̢̡̡̨̨̢̨̛̛̛̛̛̛̛̛̛͎̠̺̦͕̯̯̻͉̱͎̠̣̼̫̳̤̦̯̣̯̼̠̱͈̙̫̘̼̜̳͔̭̗̱̯̝̗̼̞̮̺̻̥͉̦̻͕̱͉̘̝̲̯̗̟͇̻̫̫̼̠͙̤͔̪̫̟͖̩͚͉͈̺̺͔̥͈̯̪͚̱͔̹̺͇̩̣̙͎͉̝̞̫̪̘͕͕̰̥̼̙̻͕͔͖̳̺̙̳̙̤̬̱͇͈̦̦̼̯̮͙̼͎̫̜͈̤̮̣̲̣̠̠̻̫͓̼͎̹̣͓̰̩̤͈̰̝̟̭͇͕̰̮͖̩̗͇͈̻͖͇͓̮̦̘̼̘͓̱̖̫̥̳͈̦͇͖̬͔̙͖̠̜̹̤̹̰͕̹̥̪̟̯͖͉̘̜̹̦̪̌̊͐̌̿̋̈̔̒̈́̾́̓̈́́͐̆̓̾́̇̃͊̓̆͋̿͑̌͊́͊͋̋͊̌̂̇͑̑̽͂̏̈́̀͋̂̈́̈́̀͂̅̑̔͑̉̃̓͗͛̓̋̽̀̒̿̈́̋̆̾̃̿̿̂̀̃̒̆̓̐̀͗̏͊̈́̈̀͒̇̄͋̏̒̊̽̓̍̑͐́̽̐͒̅̎́́̈̃̎͋̅̅̉̾́́̀̄̌̌́͛̽͛͋͐͒̔̈́̉̅̑͒̐͗̍̌͐̈́̏̆̈́̄͌̒̈͑͑̉̒͐̆̓̇͌̐̌̃̐̒͆̈́͑̑͊̈͋͗̽́̒̽̀̔̀̈̀̓̽̏̊͑̽̋̃͊́̀̓̏̌̓̈́̒̅̃̍̏̇̍̽̊̈̊̎̆̉̂̃̉̃̏̎͆̈̏̃̂͂̈́̉̽̃͛̋̈́͂̕̚͘̕̕͘̕͘͘̚̕̕͘̕͘̚̚͜͜͜͝͝͝͝͝͠͠͝͝͝͝͠͝͝͠͝͝ͅͅͅĮ̵̨̧̡̡̡̡̧̡̧̢̡̡̨̨̢̨̡̨̡̢̡̢̢̛̛̛̛̛̛̛̛̛͎̠̺̦͕̯̯̻͉̱͎̠̣̼̫̳̤̦̯̣̯̼̠̱͈̙̫̘̼̜̳͔̭̗̱̯̝̗̼̞̮̺̻̥͉̦̻͕̱͉̘̝̲̯̗̟͇̻̫̫̼̠͙̤͔̪̫̟͖̩͚͉͈̺̺͔̥͈̯̪͚̱͔̹̺͇̩̣̙͎͉̝̞̫̪̘͕͕̰̥̼̙̻͕͔͖̳̺̙̳̙̤̬̱͇͈̦̦̼̯̮͙̼͎̫̜͈̤̮̣̲̣̠̠̻̫͓̼͎̹̣͓̰̩̤͈̰̝̟̭͇͕̰̮͖̩̗͇͈̻͖͇͓̮̦̘̼̘͓̱̖̫̥̳͈̦͇͖̬͔̙͖̠̜̹̤̹̰͕̹̥̪̟̯͖͉̘̜̹̦̪̲̹͕̙̫̘͓̦̝̘̫̟̖̥̬̫̞͚̺̱͚̯̗̩̮̠̲̘͕͙̘̙̪͖͚̼͈̞̱̣̞̭̝̟̌̊͐̌̿̋̈̔̒̈́̾́̓̈́́͐̆̓̾́̇̃͊̓̆͋̿͑̌͊́͊͋̋͊̌̂̇͑̑̽͂̏̈́̀͋̂̈́̈́̀͂̅̑̔͑̉̃̓͗͛̓̋̽̀̒̿̈́̋̆̾̃̿̿̂̀̃̒̆̓̐̀͗̏͊̈́̈̀͒̇̄͋̏̒̊̽̓̍̑͐́̽̐͒̅̎́́̈̃̎͋̅̅̉̾́́̀̄̌̌́͛̽͛͋͐͒̔̈́̉̅̑͒̐͗̍̌͐̈́̏̆̈́̄͌̒̈͑͑̉̒͐̆̓̇͌̐̌̃̐̒͆̈́͑̑͊̈͋͗̽́̒̽̀̔̀̈̀̓̽̏̊͑̽̋̃͊́̀̓̏̌̓̈́̒̅̃̍̏̇̍̽̊̈̊̎̆̉̂̃̉̃̏̎͆̈̏̃̂͂̈́̉̽̃͛̋̈́͂̕̚͘̕̕͘̕͘͘̚̕̕͘̕͘̚̚͜͜͜͝͝͝͝͝͠͠͝͝͝͝͠͝͝͠͝͝ͅͅͅĮ̵̨̧̡̡̡̡̧̡̧̢̡̡̨̨̢̨̡̨̡̢̡̢̢̛̛̛̛̛̛̛̛̛͎̠̺̦͕̯̯̻͉̱͎̠̣̼̫̳̤̦̯̣̯̼̠̱͈̙̫̘̼̜̳͔̭̗̱̯̝̗̼̞̮̺̻̥͉̦̻͕̱͉̘̝̲̯̗̟͇̻̫̫̼̠͙̤͔̪̫̟͖̩͚͉͈̺̺͔̥͈̯̪͚̱͔̹̺͇̩̣̙͎͉̝̞̫̪̘͕͕̰̥̼̙̻͕͔͖̳̺̙̳̙̤̬̱͇͈̦̦̼̯̮͙̼͎̫̜͈̤̮̣̲̣̠̠̻̫͓̼͎̹̣͓̰̩̤͈̰̝̟̭͇͕̰̮͖̩̗͇͈̻͖͇͓̮̦̘̼̘͓̱̖̫̥̳͈̦͇͖̬͔̙͖̠̜̹̤̹̰͕̹̥̪̟̯͖͉̘̜̹̦̪̲̹͕̙̫̘͓̦̝̘̫̟̖̥̬̫̞͚̺̱͚̯̗̩̮̠̲̘͕͙̘̙̪͖͚̼͈̞̱̣̞̭̝̟̌̊͐̌̿̋̈̔̒̈́̾́̓̈́́͐̆̓̾́̇̃͊̓̆͋̿͑̌͊́͊͋̋͊̌̂̇͑̑̽͂̏̈́̀͋̂̈́̈́̀͂̅̑̔͑̉̃̓͗͛̓̋̽̀̒̿̈́̋̆̾̃̿̿̂̀̃̒̆̓̐̀͗̏͊̈́̈̀͒̇̄͋̏̒̊̽̓̍̑͐́̽̐͒̅̎́́̈̃̎͋̅̅̉̾́́̀̄̌̌́͛̽͛͋͐͒̔̈́̉̅̑͒̐͗̍̌͐̈́̏̆̈́̄͌̒̈͑͑̉̒͐̆̓̇͌̐̌̃̐̒͆̈́͑̑͊̈͋͗̽́̒̽̀̔̀̈̀̓̽̏̊͑̽̋̃͊́̀̓̏̌̓̈́̒̅̃̍̏̇̍̽̊̈̊̎̆̉̂̃̉̃̏̎͆̈̏̃̂͂̈́̉̽̃͛̋̈́͂̕̚͘̕̕͘̕͘͘̚̕̕͘̕͘̚̚͜͜͜͝͝͝͝͝͠͠͝͝͝͝͠͝͝͠͝͝ͅͅͅxxxixxxzzzxxxxxxĮ̵̧̢̡̡̧̡̛̛̪͖̖̣̥̟͓̣̲̗̬̰̼̤̹͙̙̥̺͚͇̗̳̣̙̯̮̝̥̲̹͍͙̮̞̤̟̭̪͈̻̬̞̖͚͖͉̤͉͇͖̯̭̪̩̩̻̳̤̮̳̻͔̦̦͚̒͆̍͌̈̽̊͋̅̽̽̈́͂́̈́̃̀̔͌̍̉̏̇͂̈́͐̃̓́̉̎̌̓́̌̃͌͗́̑͗̄͋͒̋͊̿̊̊̅̕͝͠͠͝͠͠͠ͅͅĮ̵̧̢̡̡̧̡̛̛̪͖̖̣̥̟͓̣̲̗̬̰̼̤̹͙̙̥̺͚͇̗̳̣̙̯̮̝̥̲̹͍͙̮̞̤̟̭̪͈̻̬̞̖͚͖͉̤͉͇͖̯̭̪̩̩̻̳̤̮̳̻͔̦̦͚̒͆̍͌̈̽̊͋̅̽̽̈́͂́̈́̃̀̔͌̍̉̏̇͂̈́͐̃̓́̉̎̌̓́̌̃͌͗́̑͗̄͋͒̋͊̿̊̊̅̕͝͠͠͝͠͠͠ͅͅĮ̵̨̧̡̡̡̡̧̡̧̢̡̡̨̨̢̨̡̨̡̢̡̢̢̛̛̛̛̛̛̛̛̛͎̠̺̦͕̯̯̻͉̱͎̠̣̼̫̳̤̦̯̣̯̼̠̱͈̙̫̘̼̜̳͔̭̗̱̯̝̗̼̞̮̺̻̥͉̦̻͕̱͉̘̝̲̯̗̟͇̻̫̫̼̠͙̤͔̪̫̟͖̩͚͉͈̺̺͔̥͈̯̪͚̱͔̹̺͇̩̣̙͎͉̝̞̫̪̘͕͕̰̥̼̙̻͕͔͖̳̺̙̳̙̤̬̱͇͈̦̦̼̯̮͙̼͎̫̜͈̤̮̣̲̣̠̠̻̫͓̼͎̹̣͓̰̩̤͈̰̝̟̭͇͕̰̮͖̩̗͇͈̻͖͇͓̮̦̘̼̘͓̱̖̫̥̳͈̦͇͖̬͔̙͖̠̜̹̤̹̰͕̹̥̪̟̯͖͉̘̜̹̦̪̲̹͕̙̫̘͓̦̝̘̫̟̖̥̬̫̞͚̺̱͚̯̗̩̮̠̲̘͕͙̘̙̪͖͚̼͈̞̱̣̞̭̝̟̌̊͐̌̿̋̈̔̒̈́̾́̓̈́́͐̆̓̾́̇̃͊̓̆͋̿͑̌͊́͊͋̋͊̌̂̇͑̑̽͂̏̈́̀͋̂̈́̈́̀͂̅̑̔͑̉̃̓͗͛̓̋̽̀̒̿̈́̋̆̾̃̿̿̂̀̃̒̆̓̐̀͗̏͊̈́̈̀͒̇̄͋̏̒̊̽̓̍̑͐́̽̐͒̅̎́́̈̃̎͋̅̅̉̾́́̀̄̌̌́͛̽͛͋͐͒̔̈́̉̅̑͒̐͗̍̌͐̈́̏̆̈́̄͌̒̈͑͑̉̒͐̆̓̇͌̐̌̃̐̒͆̈́͑̑͊̈͋͗̽́̒̽̀̔̀̈̀̓̽̏̊͑̽̋̃͊́̀̓̏̌̓̈́̒̅̃̍̏̇̍̽̊̈̊̎̆̉̂̃̉̃̏̎͆̈̏̃̂͂̈́̉̽̃͛̋̈́͂̕̚͘̕̕͘̕͘͘̚̕̕͘̕͘̚̚͜͜͜͝͝͝͝͝͠͠͝͝͝͝͠͝͝͠͝͝ͅͅͅ[xĮ̵̨̧̡̡̡̡̧̡̧̢̡̡̨̨̢̨̛̛̛̛̛̛̛̛̛͎̠̺̦͕̯̯̻͉̱͎̠̣̼̫̳̤̦̯̣̯̼̠̱͈̙̫̘̼̜̳͔̭̗̱̯̝̗̼̞̮̺̻̥͉̦̻͕̱͉̘̝̲̯̗̟͇̻̫̫̼̠͙̤͔̪̫̟͖̩͚͉͈̺̺͔̥͈̯̪͚̱͔̹̺͇̩̣̙͎͉̝̞̫̪̘͕͕̰̥̼̙̻͕͔͖̳̺̙̳̙̤̬̱͇͈̦̦̼̯̮͙̼͎̫̜͈̤̮̣̲̣̠̠̻̫͓̼͎̹̣͓̰̩̤͈̰̝̟̭͇͕̰̮͖̩̗͇͈̻͖͇͓̮̦̘̼̘͓̱̖̫̥̳͈̦͇͖̬͔̙͖̠̜̹̤̹̰͕̹̥̪̟̯͖͉̘̜̹̦̪̌̊͐̌̿̋̈̔̒̈́̾́̓̈́́͐̆̓̾́̇̃͊̓̆͋̿͑̌͊́͊͋̋͊̌̂̇͑̑̽͂̏̈́̀͋̂̈́̈́̀͂̅̑̔͑̉̃̓͗͛̓̋̽̀̒̿̈́̋̆̾̃̿̿̂̀̃̒̆̓̐̀͗̏͊̈́̈̀͒̇̄͋̏̒̊̽̓̍̑͐́̽̐͒̅̎́́̈̃̎͋̅̅̉̾́́̀̄̌̌́͛̽͛͋͐͒̔̈́̉̅̑͒̐͗̍̌͐̈́̏̆̈́̄͌̒̈͑͑̉̒͐̆̓̇͌̐̌̃̐̒͆̈́͑̑͊̈͋͗̽́̒̽̀̔̀̈̀̓̽̏̊͑̽̋̃͊́̀̓̏̌̓̈́̒̅̃̍̏̇̍̽̊̈̊̎̆̉̂̃̉̃̏̎͆̈̏̃̂͂̈́̉̽̃͛̋̈́͂̕̚͘̕̕͘̕͘͘̚̕̕͘̕͘̚̚͜͜͜͝͝͝͝͝͠͠͝͝͝͝͠͝͝͠͝͝ͅͅͅĮ̵̧̢̡̡̧̡̛̛̪͖̖̣̥̟͓̣̲̗̬̰̼̤̹͙̙̥̺͚͇̗̳̣̙̯̮̝̥̲̹͍͙̮̞̤̟̭̪͈̻̬̞̖͚͖͉̤͉͇͖̯̭̪̩̩̻̳̤̮̳̻͔̦̦͚̒͆̍͌̈̽̊͋̅̽̽̈́͂́̈́̃̀̔͌̍̉̏̇͂̈́͐̃̓́̉̎̌̓́̌̃͌͗́̑͗̄͋͒̋͊̿̊̊̅̕͝͠͠͝͠͠͠ͅͅĮ̵̧̢̡̡̧̡̛̛̪͖̖̣̥̟͓̣̲̗̬̰̼̤̹͙̙̥̺͚͇̗̳̣̙̯̮̝̥̲̹͍͙̮̞̤̟̭̪͈̻̬̞̖͚͖͉̤͉͇͖̯̭̪̩̩̻̳̤̮̳̻͔̦̦͚̒͆̍͌̈̽̊͋̅̽̽̈́͂́̈́̃̀̔͌̍̉̏̇͂̈́͐̃̓́̉̎̌̓́̌̃͌͗́̑͗̄͋͒̋͊̿̊̊̅̕͝͠͠͝͠͠͠ͅͅ[xĮ̵̨̧̡̡̡̡̧̡̧̢̡̡̨̨̢̨̛̛̛̛̛̛̛̛̛͎̠̺̦͕̯̯̻͉̱͎̠̣̼̫̳̤̦̯̣̯̼̠̱͈̙̫̘̼̜̳͔̭̗̱̯̝̗̼̞̮̺̻̥͉̦̻͕̱͉̘̝̲̯̗̟͇̻̫̫̼̠͙̤͔̪̫̟͖̩͚͉͈̺̺͔̥͈̯̪͚̱͔̹̺͇̩̣̙͎͉̝̞̫̪̘͕͕̰̥̼̙̻͕͔͖̳̺̙̳̙̤̬̱͇͈̦̦̼̯̮͙̼͎̫̜͈̤̮̣̲̣̠̠̻̫͓̼͎̹̣͓̰̩̤͈̰̝̟̭͇͕̰̮͖̩̗͇͈̻͖͇͓̮̦̘̼̘͓̱̖̫̥̳͈̦͇͖̬͔̙͖̠̜̹̤̹̰͕̹̥̪̟̯͖͉̘̜̹̦̪̌̊͐̌̿̋̈̔̒̈́̾́̓̈́́͐̆̓̾́̇̃͊̓̆͋̿͑̌͊́͊͋̋͊̌̂̇͑̑̽͂̏̈́̀͋̂̈́̈́̀͂̅̑̔͑̉̃̓͗͛̓̋̽̀̒̿̈́̋̆̾̃̿̿̂̀̃̒̆̓̐̀͗̏͊̈́̈̀͒̇̄͋̏̒̊̽̓̍̑͐́̽̐͒̅̎́́̈̃̎͋̅̅̉̾́́̀̄̌̌́͛̽͛͋͐͒̔̈́̉̅̑͒̐͗̍̌͐̈́̏̆̈́̄͌̒̈͑͑̉̒͐̆̓̇͌̐̌̃̐̒͆̈́͑̑͊̈͋͗̽́̒̽̀̔̀̈̀̓̽̏̊͑̽̋̃͊́̀̓̏̌̓̈́̒̅̃̍̏̇̍̽̊̈̊̎̆̉̂̃̉̃̏̎͆̈̏̃̂͂̈́̉̽̃͛̋̈́͂̕̚͘̕̕͘̕͘͘̚̕̕͘̕͘̚̚͜͜͜͝͝͝͝͝͠͠͝͝͝͝͠͝͝͠͝͝ͅͅͅĮ̵̨̧̡̡̡̡̧̡̧̢̡̡̨̨̢̨̡̨̡̢̡̢̢̛̛̛̛̛̛̛̛̛͎̠̺̦͕̯̯̻͉̱͎̠̣̼̫̳̤̦̯̣̯̼̠̱͈̙̫̘̼̜̳͔̭̗̱̯̝̗̼̞̮̺̻̥͉̦̻͕̱͉̘̝̲̯̗̟͇̻̫̫̼̠͙̤͔̪̫̟͖̩͚͉͈̺̺͔̥͈̯̪͚̱͔̹̺͇̩̣̙͎͉̝̞̫̪̘͕͕̰̥̼̙̻͕͔͖̳̺̙̳̙̤̬̱͇͈̦̦̼̯̮͙̼͎̫̜͈̤̮̣̲̣̠̠̻̫͓̼͎̹̣͓̰̩̤͈̰̝̟̭͇͕̰̮͖̩̗͇͈̻͖͇͓̮̦̘̼̘͓̱̖̫̥̳͈̦͇͖̬͔̙͖̠̜̹̤̹̰͕̹̥̪̟̯͖͉̘̜̹̦̪̲̹͕̙̫̘͓̦̝̘̫̟̖̥̬̫̞͚̺̱͚̯̗̩̮̠̲̘͕͙̘̙̪͖͚̼͈̞̱̣̞̭̝̟̌̊͐̌̿̋̈̔̒̈́̾́̓̈́́͐̆̓̾́̇̃͊̓̆͋̿͑̌͊́͊͋̋͊̌̂̇͑̑̽͂̏̈́̀͋̂̈́̈́̀͂̅̑̔͑̉̃̓͗͛̓̋̽̀̒̿̈́̋̆̾̃̿̿̂̀̃̒̆̓̐̀͗̏͊̈́̈̀͒̇̄͋̏̒̊̽̓̍̑͐́̽̐͒̅̎́́̈̃̎͋̅̅̉̾́́̀̄̌̌́͛̽͛͋͐͒̔̈́̉̅̑͒̐͗̍̌͐̈́̏̆̈́̄͌̒̈͑͑̉̒͐̆̓̇͌̐̌̃̐̒͆̈́͑̑͊̈͋͗̽́̒̽̀̔̀̈̀̓̽̏̊͑̽̋̃͊́̀̓̏̌̓̈́̒̅̃̍̏̇̍̽̊̈̊̎̆̉̂̃̉̃̏̎͆̈̏̃̂͂̈́̉̽̃͛̋̈́͂̕̚͘̕̕͘̕͘͘̚̕̕͘̕͘̚̚͜͜͜͝͝͝͝͝͠͠͝͝͝͝͠͝͝͠͝͝ͅͅͅĮ̵̨̧̡̡̡̡̧̡̧̢̡̡̨̨̢̨̡̨̡̢̡̢̢̛̛̛̛̛̛̛̛̛͎̠̺̦͕̯̯̻͉̱͎̠̣̼̫̳̤̦̯̣̯̼̠̱͈̙̫̘̼̜̳͔̭̗̱̯̝̗̼̞̮̺̻̥͉̦̻͕̱͉̘̝̲̯̗̟͇̻̫̫̼̠͙̤͔̪̫̟͖̩͚͉͈̺̺͔̥͈̯̪͚̱͔̹̺͇̩̣̙͎͉̝̞̫̪̘͕͕̰̥̼̙̻͕͔͖̳̺̙̳̙̤̬̱͇͈̦̦̼̯̮͙̼͎̫̜͈̤̮̣̲̣̠̠̻̫͓̼͎̹̣͓̰̩̤͈̰̝̟̭͇͕̰̮͖̩̗͇͈̻͖͇͓̮̦̘̼̘͓̱̖̫̥̳͈̦͇͖̬͔̙͖̠̜̹̤̹̰͕̹̥̪̟̯͖͉̘̜̹̦̪̲̹͕̙̫̘͓̦̝̘̫̟̖̥̬̫̞͚̺̱͚̯̗̩̮̠̲̘͕͙̘̙̪͖͚̼͈̞̱̣̞̭̝̟̌̊͐̌̿̋̈̔̒̈́̾́̓̈́́͐̆̓̾́̇̃͊̓̆͋̿͑̌͊́͊͋̋͊̌̂̇͑̑̽͂̏̈́̀͋̂̈́̈́̀͂̅̑̔͑̉̃̓͗͛̓̋̽̀̒̿̈́̋̆̾̃̿̿̂̀̃̒̆̓̐̀͗̏͊̈́̈̀͒̇̄͋̏̒̊̽̓̍̑͐́̽̐͒̅̎́́̈̃̎͋̅̅̉̾́́̀̄̌̌́͛̽͛͋͐͒̔̈́̉̅̑͒̐͗̍̌͐̈́̏̆̈́̄͌̒̈͑͑̉̒͐̆̓̇͌̐̌̃̐̒͆̈́͑̑͊̈͋͗̽́̒̽̀̔̀̈̀̓̽̏̊͑̽̋̃͊́̀̓̏̌̓̈́̒̅̃̍̏̇̍̽̊̈̊̎̆̉̂̃̉̃̏̎͆̈̏̃̂͂̈́̉̽̃͛̋̈́͂̕̚͘̕̕͘̕͘͘̚̕̕͘̕͘̚̚͜͜͜͝͝͝͝͝͠͠͝͝͝͝͠͝͝͠͝͝ͅͅͅ[xizĮ̵̨̧̡̡̡̡̧̡̧̢̡̡̨̨̢̨̛̛̛̛̛̛̛̛̛͎̠̺̦͕̯̯̻͉̱͎̠̣̼̫̳̤̦̯̣̯̼̠̱͈̙̫̘̼̜̳͔̭̗̱̯̝̗̼̞̮̺̻̥͉̦̻͕̱͉̘̝̲̯̗̟͇̻̫̫̼̠͙̤͔̪̫̟͖̩͚͉͈̺̺͔̥͈̯̪͚̱͔̹̺͇̩̣̙͎͉̝̞̫̪̘͕͕̰̥̼̙̻͕͔͖̳̺̙̳̙̤̬̱͇͈̦̦̼̯̮͙̼͎̫̜͈̤̮̣̲̣̠̠̻̫͓̼͎̹̣͓̰̩̤͈̰̝̟̭͇͕̰̮͖̩̗͇͈̻͖͇͓̮̦̘̼̘͓̱̖̫̥̳͈̦͇͖̬͔̙͖̠̜̹̤̹̰͕̹̥̪̟̯͖͉̘̜̹̦̪̌̊͐̌̿̋̈̔̒̈́̾́̓̈́́͐̆̓̾́̇̃͊̓̆͋̿͑̌͊́͊͋̋͊̌̂̇͑̑̽͂̏̈́̀͋̂̈́̈́̀͂̅̑̔͑̉̃̓͗͛̓̋̽̀̒̿̈́̋̆̾̃̿̿̂̀̃̒̆̓̐̀͗̏͊̈́̈̀͒̇̄͋̏̒̊̽̓̍̑͐́̽̐͒̅̎́́̈̃̎͋̅̅̉̾́́̀̄̌̌́͛̽͛͋͐͒̔̈́̉̅̑͒̐͗̍̌͐̈́̏̆̈́̄͌̒̈͑͑̉̒͐̆̓̇͌̐̌̃̐̒͆̈́͑̑͊̈͋͗̽́̒̽̀̔̀̈̀̓̽̏̊͑̽̋̃͊́̀̓̏̌̓̈́̒̅̃̍̏̇̍̽̊̈̊̎̆̉̂̃̉̃̏̎͆̈̏̃̂͂̈́̉̽̃͛̋̈́͂̕̚͘̕̕͘̕͘͘̚̕̕͘̕͘̚̚͜͜͜͝͝͝͝͝͠͠͝͝͝͝͠͝͝͠͝͝ͅͅͅĮ̵̨̧̡̡̡̡̧̡̧̢̡̡̨̨̢̨̡̨̡̢̡̢̢̛̛̛̛̛̛̛̛̛͎̠̺̦͕̯̯̻͉̱͎̠̣̼̫̳̤̦̯̣̯̼̠̱͈̙̫̘̼̜̳͔̭̗̱̯̝̗̼̞̮̺̻̥͉̦̻͕̱͉̘̝̲̯̗̟͇̻̫̫̼̠͙̤͔̪̫̟͖̩͚͉͈̺̺͔̥͈̯̪͚̱͔̹̺͇̩̣̙͎͉̝̞̫̪̘͕͕̰̥̼̙̻͕͔͖̳̺̙̳̙̤̬̱͇͈̦̦̼̯̮͙̼͎̫̜͈̤̮̣̲̣̠̠̻̫͓̼͎̹̣͓̰̩̤͈̰̝̟̭͇͕̰̮͖̩̗͇͈̻͖͇͓̮̦̘̼̘͓̱̖̫̥̳͈̦͇͖̬͔̙͖̠̜̹̤̹̰͕̹̥̪̟̯͖͉̘̜̹̦̪̲̹͕̙̫̘͓̦̝̘̫̟̖̥̬̫̞͚̺̱͚̯̗̩̮̠̲̘͕͙̘̙̪͖͚̼͈̞̱̣̞̭̝̟̌̊͐̌̿̋̈̔̒̈́̾́̓̈́́͐̆̓̾́̇̃͊̓̆͋̿͑̌͊́͊͋̋͊̌̂̇͑̑̽͂̏̈́̀͋̂̈́̈́̀͂̅̑̔͑̉̃̓͗͛̓̋̽̀̒̿̈́̋̆̾̃̿̿̂̀̃̒̆̓̐̀͗̏͊̈́̈̀͒̇̄͋̏̒̊̽̓̍̑͐́̽̐͒̅̎́́̈̃̎͋̅̅̉̾́́̀̄̌̌́͛̽͛͋͐͒̔̈́̉̅̑͒̐͗̍̌͐̈́̏̆̈́̄͌̒̈͑͑̉̒͐̆̓̇͌̐̌̃̐̒͆̈́͑̑͊̈͋͗̽́̒̽̀̔̀̈̀̓̽̏̊͑̽̋̃͊́̀̓̏̌̓̈́̒̅̃̍̏̇̍̽̊̈̊̎̆̉̂̃̉̃̏̎͆̈̏̃̂͂̈́̉̽̃͛̋̈́͂̕̚͘̕̕͘̕͘͘̚̕̕͘̕͘̚̚͜͜͜͝͝͝͝͝͠͠͝͝͝͝͠͝͝͠͝͝ͅͅͅĮ̵̨̧̡̡̡̡̧̡̧̢̡̡̨̨̢̨̡̨̡̢̡̢̢̛̛̛̛̛̛̛̛̛͎̠̺̦͕̯̯̻͉̱͎̠̣̼̫̳̤̦̯̣̯̼̠̱͈̙̫̘̼̜̳͔̭̗̱̯̝̗̼̞̮̺̻̥͉̦̻͕̱͉̘̝̲̯̗̟͇̻̫̫̼̠͙̤͔̪̫̟͖̩͚͉͈̺̺͔̥͈̯̪͚̱͔̹̺͇̩̣̙͎͉̝̞̫̪̘͕͕̰̥̼̙̻͕͔͖̳̺̙̳̙̤̬̱͇͈̦̦̼̯̮͙̼͎̫̜͈̤̮̣̲̣̠̠̻̫͓̼͎̹̣͓̰̩̤͈̰̝̟̭͇͕̰̮͖̩̗͇͈̻͖͇͓̮̦̘̼̘͓̱̖̫̥̳͈̦͇͖̬͔̙͖̠̜̹̤̹̰͕̹̥̪̟̯͖͉̘̜̹̦̪̲̹͕̙̫̘͓̦̝̘̫̟̖̥̬̫̞͚̺̱͚̯̗̩̮̠̲̘͕͙̘̙̪͖͚̼͈̞̱̣̞̭̝̟̌̊͐̌̿̋̈̔̒̈́̾́̓̈́́͐̆̓̾́̇̃͊̓̆͋̿͑̌͊́͊͋̋͊̌̂̇͑̑̽͂̏̈́̀͋̂̈́̈́̀͂̅̑̔͑̉̃̓͗͛̓̋̽̀̒̿̈́̋̆̾̃̿̿̂̀̃̒̆̓̐̀͗̏͊̈́̈̀͒̇̄͋̏̒̊̽̓̍̑͐́̽̐͒̅̎́́̈̃̎͋̅̅̉̾́́̀̄̌̌́͛̽͛͋͐͒̔̈́̉̅̑͒̐͗̍̌͐̈́̏̆̈́̄͌̒̈͑͑̉̒͐̆̓̇͌̐̌̃̐̒͆̈́͑̑͊̈͋͗̽́̒̽̀̔̀̈̀̓̽̏̊͑̽̋̃͊́̀̓̏̌̓̈́̒̅̃̍̏̇̍̽̊̈̊̎̆̉̂̃̉̃̏̎͆̈̏̃̂͂̈́̉̽̃͛̋̈́͂̕̚͘̕̕͘̕͘͘̚̕̕͘̕͘̚̚͜͜͜͝͝͝͝͝͠͠͝͝͝͝͠͝͝͠͝͝ͅͅͅ[
x危险危险危险危险危险危险危险危险危险 ┓\̴̨̨̜̺̝̦̠̓͘/̷͉̥̒̈̊̅̓̃̾̈̇́\̸̢̡̡̞͙̪̟̦͈͍̟͎̹͈̻͈̞̣͕̙̥̗͕͙̱͙͉̳͙̘͇̼̻͈̱̙̗̱͓̰̗͎̇͒́̆͠
\̴̨̨̜̺̝̦̠̓͘/̷͉̥̒̈̊̅̓̃̾̈̇́ Ỉ̴̧̢̡̛͙̩͙̗͙̳̤̣̞͉̦̬͍̦͖̣̠̪̺̖̩̭̳̻̗͕̺̮̞̝̳̥͉͕̮͕̦̪͈̯͔͚̳͎̔̋͂̌̂͐͊̉̐͜͜͜͝ͅ┗ixx紧急紧急紧急紧急 \̴̨̨̜̺̝̦̠̓͘ Į̵̨̧̡̡̡̡̧̡̧̢̡̡̨̨̢̨̛̛̛̛̛̛̛̛̛͎̠̺̦͕̯̯̻͉̱͎̠̣̼̫̳̤̦̯̣̯̼̠̱͈̙̫̘̼̜̳͔̭̗̱̯̝̗̼̞̮̺̻̥͉̦̻͕̱͉̘̝̲̯̗̟͇̻̫̫̼̠͙̤͔̪̫̟͖̩͚͉͈̺̺͔̥͈̯̪͚̱͔̹̺͇̩̣̙͎͉̝̞̫̪̘͕͕̰̥̼̙̻͕͔͖̳̺̙̳̙̤̬̱͇͈̦̦̼̯̮͙̼͎̫̜͈̤̮̣̲̣̠̠̻̫͓̼͎̹̣͓̰̩̤͈̰̝̟̭͇͕̰̮͖̩̗͇͈̻͖͇͓̮̦̘̼̘͓̱̖̫̥̳͈̦͇͖̬͔̙͖̠̜̹̤̹̰͕̹̥̪̟̯͖͉̘̜̹̦̪̌̊͐̌̿̋̈̔̒̈́̾́̓̈́́͐̆̓̾́̇̃͊̓̆͋̿͑̌͊́͊͋̋͊̌̂̇͑̑̽͂̏̈́̀͋̂̈́̈́̀͂̅̑̔͑̉̃̓͗͛̓̋̽̀̒̿̈́̋̆̾̃̿̿̂̀̃̒̆̓̐̀͗̏͊̈́̈̀͒̇̄͋̏̒̊̽̓̍̑͐́̽̐͒̅̎́́̈̃̎͋̅̅̉̾́́̀̄̌̌́͛̽͛͋͐͒̔̈́̉̅̑͒̐͗̍̌͐̈́̏̆̈́̄͌̒̈͑͑̉̒͐̆̓̇͌̐̌̃̐̒͆̈́͑̑͊̈͋͗̽́̒̽̀̔̀̈̀̓̽̏̊͑̽̋̃͊́̀̓̏̌̓̈́̒̅̃̍̏̇̍̽̊̈̊̎̆̉̂̃̉̃̏̎͆̈̏̃̂͂̈́̉̽̃͛̋̈́͂̕̚͘̕̕͘̕͘͘̚̕̕͘̕͘̚̚͜͜͜͝͝͝͝͝͠͠͝͝͝͝͠͝͝͠͝͝ͅͅͅ
Į̵̨̧̡̡̡̡̧̡̧̢̡̡̨̨̢̨̡̨̡̢̡̢̢̛̛̛̛̛̛̛̛̛͎̠̺̦͕̯̯̻͉̱͎̠̣̼̫̳̤̦̯̣̯̼̠̱͈̙̫̘̼̜̳͔̭̗̱̯̝̗̼̞̮̺̻̥͉̦̻͕̱͉̘̝̲̯̗̟͇̻̫̫̼̠͙̤͔̪̫̟͖̩͚͉͈̺̺͔̥͈̯̪͚̱͔̹̺͇̩̣̙͎͉̝̞̫̪̘͕͕̰̥̼̙̻͕͔͖̳̺̙̳̙̤̬̱͇͈̦̦̼̯̮͙̼͎̫̜͈̤̮̣̲̣̠̠̻̫͓̼͎̹̣͓̰̩̤͈̰̝̟̭͇͕̰̮͖̩̗͇͈̻͖͇͓̮̦̘̼̘͓̱̖̫̥̳͈̦͇͖̬͔̙͖̠̜̹̤̹̰͕̹̥̪̟̯͖͉̘̜̹̦̪̲̹͕̙̫̘͓̦̝̘̫̟̖̥̬̫̞͚̺̱͚̯̗̩̮̠̲̘͕͙̘̙̪͖͚̼͈̞̱̣̞̭̝̟̌̊͐̌̿̋̈̔̒̈́̾́̓̈́́͐̆̓̾́̇̃͊̓̆͋̿͑̌͊́͊͋̋͊̌̂̇͑̑̽͂̏̈́̀͋̂̈́̈́̀͂̅̑̔͑̉̃̓͗͛̓̋̽̀̒̿̈́̋̆̾̃̿̿̂̀̃̒̆̓̐̀͗̏͊̈́̈̀͒̇̄͋̏̒̊̽̓̍̑͐́̽̐͒̅̎́́̈̃̎͋̅̅̉̾́́̀̄̌̌́͛̽͛͋͐͒̔̈́̉̅̑͒̐͗̍̌͐̈́̏̆̈́̄͌̒̈͑͑̉̒͐̆̓̇͌̐̌̃̐̒͆̈́͑̑͊̈͋͗̽́̒̽̀̔̀̈̀̓̽̏̊͑̽̋̃͊́̀̓̏̌̓̈́̒̅̃̍̏̇̍̽̊̈̊̎̆̉̂̃̉̃̏̎͆̈̏̃̂͂̈́̉̽̃͛̋̈́͂̕̚͘̕̕͘̕͘͘̚̕̕͘̕͘̚̚͜͜͜͝͝͝͝͝͠͠͝͝͝͝͠͝͝͠͝͝ͅͅͅĮ̵̨̧̡̡̡̡̧̡̧̢̡̡̨̨̢̨̡̨̡̢̡̢̢̛̛̛̛̛̛̛̛̛͎̠̺̦͕̯̯̻͉̱͎̠̣̼̫̳̤̦̯̣̯̼̠̱͈̙̫̘̼̜̳͔̭̗̱̯̝̗̼̞̮̺̻̥͉̦̻͕̱͉̘̝̲̯̗̟͇̻̫̫̼̠͙̤͔̪̫̟͖̩͚͉͈̺̺͔̥͈̯̪͚̱͔̹̺͇̩̣̙͎͉̝̞̫̪̘͕͕̰̥̼̙̻͕͔͖̳̺̙̳̙̤̬̱͇͈̦̦̼̯̮͙̼͎̫̜͈̤̮̣̲̣̠̠̻̫͓̼͎̹̣͓̰̩̤͈̰̝̟̭͇͕̰̮͖̩̗͇͈̻͖͇͓̮̦̘̼̘͓̱̖̫̥̳͈̦͇͖̬͔̙͖̠̜̹̤̹̰͕̹̥̪̟̯͖͉̘̜̹̦̪̲̹͕̙̫̘͓̦̝̘̫̟̖̥̬̫̞͚̺̱͚̯̗̩̮̠̲̘͕͙̘̙̪͖͚̼͈̞̱̣̞̭̝̟̌̊͐̌̿̋̈̔̒̈́̾́̓̈́́͐̆̓̾́̇̃͊̓̆͋̿͑̌͊́͊͋̋͊̌̂̇͑̑̽͂̏̈́̀͋̂̈́̈́̀͂̅̑̔͑̉̃̓͗͛̓̋̽̀̒̿̈́̋̆̾̃̿̿̂̀̃̒̆̓̐̀͗̏͊̈́̈̀͒̇̄͋̏̒̊̽̓̍̑͐́̽̐͒̅̎́́̈̃̎͋̅̅̉̾́́̀̄̌̌́͛̽͛͋͐͒̔̈́̉̅̑͒̐͗̍̌͐̈́̏̆̈́̄͌̒̈͑͑̉̒͐̆̓̇͌̐̌̃̐̒͆̈́͑̑͊̈͋͗̽́̒̽̀̔̀̈̀̓̽̏̊͑̽̋̃͊́̀̓̏̌̓̈́̒̅̃̍̏̇̍̽̊̈̊̎̆̉̂̃̉̃̏̎͆̈̏̃̂͂̈́̉̽̃͛̋̈́͂̕̚͘̕̕͘̕͘͘̚̕̕͘̕͘̚̚͜͜͜͝͝͝͝͝͠͠͝͝͝͝͠͝͝͠͝͝ͅͅͅxxxxnĮ̵̨̧̡̡̡̡̧̡̧̢̡̡̨̨̢̨̡̨̡̢̡̢̢̛̛̛̛̛̛̛̛̛͎̠̺̦͕̯̯̻͉̱͎̠̣̼̫̳̤̦̯̣̯̼̠̱͈̙̫̘̼̜̳͔̭̗̱̯̝̗̼̞̮̺̻̥͉̦̻͕̱͉̘̝̲̯̗̟͇̻̫̫̼̠͙̤͔̪̫̟͖̩͚͉͈̺̺͔̥͈̯̪͚̱͔̹̺͇̩̣̙͎͉̝̞̫̪̘͕͕̰̥̼̙̻͕͔͖̳̺̙̳̙̤̬̱͇͈̦̦̼̯̮͙̼͎̫̜͈̤̮̣̲̣̠̠̻̫͓̼͎̹̣͓̰̩̤͈̰̝̟̭͇͕̰̮͖̩̗͇͈̻͖͇͓̮̦̘̼̘͓̱̖̫̥̳͈̦͇͖̬͔̙͖̠̜̹̤̹̰͕̹̥̪̟̯͖͉̘̜̹̦̪̲̹͕̙̫̘͓̦̝̘̫̟̖̥̬̫̞͚̺̱͚̯̗̩̮̠̲̘͕͙̘̙̪͖͚̼͈̞̱̣̞̭̝̟̌̊͐̌̿̋̈̔̒̈́̾́̓̈́́͐̆̓̾́̇̃͊̓̆͋̿͑̌͊́͊͋̋͊̌̂̇͑̑̽͂̏̈́̀͋̂̈́̈́̀͂̅̑̔͑̉̃̓͗͛̓̋̽̀̒̿̈́̋̆̾̃̿̿̂̀̃̒̆̓̐̀͗̏͊̈́̈̀͒̇̄͋̏̒̊̽̓̍̑͐́̽̐͒̅̎́́̈̃̎͋̅̅̉̾́́̀̄̌̌́͛̽͛͋͐͒̔̈́̉̅̑͒̐͗̍̌͐̈́̏̆̈́̄͌̒̈͑͑̉̒͐̆̓̇͌̐̌̃̐̒͆̈́͑̑͊̈͋͗̽́̒̽̀̔̀̈̀̓̽̏̊͑̽̋̃͊́̀̓̏̌̓̈́̒̅̃̍̏̇̍̽̊̈̊̎̆̉̂̃̉̃̏̎͆̈̏̃̂͂̈́̉̽̃͛̋̈́͂̕̚͘̕̕͘̕͘͘̚̕̕͘̕͘̚̚͜͜͜͝͝͝͝͝͠͠͝͝͝͝͠͝͝͠͝͝ͅͅͅĮ̵̨̧̡̡̡̡̧̡̧̢̡̡̨̨̢̨̡̨̡̢̡̢̢̛̛̛̛̛̛̛̛̛͎̠̺̦͕̯̯̻͉̱͎̠̣̼̫̳̤̦̯̣̯̼̠̱͈̙̫̘̼̜̳͔̭̗̱̯̝̗̼̞̮̺̻̥͉̦̻͕̱͉̘̝̲̯̗̟͇̻̫̫̼̠͙̤͔̪̫̟͖̩͚͉͈̺̺͔̥͈̯̪͚̱͔̹̺͇̩̣̙͎͉̝̞̫̪̘͕͕̰̥̼̙̻͕͔͖̳̺̙̳̙̤̬̱͇͈̦̦̼̯̮͙̼͎̫̜͈̤̮̣̲̣̠̠̻̫͓̼͎̹̣͓̰̩̤͈̰̝̟̭͇͕̰̮͖̩̗͇͈̻͖͇͓̮̦̘̼̘͓̱̖̫̥̳͈̦͇͖̬͔̙͖̠̜̹̤̹̰͕̹̥̪̟̯͖͉̘̜̹̦̪̲̹͕̙̫̘͓̦̝̘̫̟̖̥̬̫̞͚̺̱͚̯̗̩̮̠̲̘͕͙̘̙̪͖͚̼͈̞̱̣̞̭̝̟̌̊͐̌̿̋̈̔̒̈́̾́̓̈́́͐̆̓̾́̇̃͊̓̆͋̿͑̌͊́͊͋̋͊̌̂̇͑̑̽͂̏̈́̀͋̂̈́̈́̀͂̅̑̔͑̉̃̓͗͛̓̋̽̀̒̿̈́̋̆̾̃̿̿̂̀̃̒̆̓̐̀͗̏͊̈́̈̀͒̇̄͋̏̒̊̽̓̍̑͐́̽̐͒̅̎́́̈̃̎͋̅̅̉̾́́̀̄̌̌́͛̽͛͋͐͒̔̈́̉̅̑͒̐͗̍̌͐̈́̏̆̈́̄͌̒̈͑͑̉̒͐̆̓̇͌̐̌̃̐̒͆̈́͑̑͊̈͋͗̽́̒̽̀̔̀̈̀̓̽̏̊͑̽̋̃͊́̀̓̏̌̓̈́̒̅̃̍̏̇̍̽̊̈̊̎̆̉̂̃̉̃̏̎͆̈̏̃̂͂̈́̉̽̃͛̋̈́͂̕̚͘̕̕͘̕͘͘̚̕̕͘̕͘̚̚͜͜͜͝͝͝͝͝͠͠͝͝͝͝͠͝͝͠͝͝ͅͅͅĮ̵̧̢̡̡̧̡̛̛̪͖̖̣̥̟͓̣̲̗̬̰̼̤̹͙̙̥̺͚͇̗̳̣̙̯̮̝̥̲̹͍͙̮̞̤̟̭̪͈̻̬̞̖͚͖͉̤͉͇͖̯̭̪̩̩̻̳̤̮̳̻͔̦̦͚̒͆̍͌̈̽̊͋̅̽̽̈́͂́̈́̃̀̔͌̍̉̏̇͂̈́͐̃̓́̉̎̌̓́̌̃͌͗́̑͗̄͋͒̋͊̿̊̊̅̕͝͠͠͝͠͠͠ͅͅĮ̵̧̢̡̡̧̡̛̛̪͖̖̣̥̟͓̣̲̗̬̰̼̤̹͙̙̥̺͚͇̗̳̣̙̯̮̝̥̲̹͍͙̮̞̤̟̭̪͈̻̬̞̖͚͖͉̤͉͇͖̯̭̪̩̩̻̳̤̮̳̻͔̦̦͚̒͆̍͌̈̽̊͋̅̽̽̈́͂́̈́̃̀̔͌̍̉̏̇͂̈́͐̃̓́̉̎̌̓́̌̃͌͗́̑͗̄͋͒̋͊̿̊̊̅̕͝͠͠͝͠͠͠ͅͅĮ̵̨̧̡̡̡̡̧̡̧̢̡̡̨̨̢̨̛̛̛̛̛̛̛̛̛͎̠̺̦͕̯̯̻͉̱͎̠̣̼̫̳̤̦̯̣̯̼̠̱͈̙̫̘̼̜̳͔̭̗̱̯̝̗̼̞̮̺̻̥͉̦̻͕̱͉̘̝̲̯̗̟͇̻̫̫̼̠͙̤͔̪̫̟͖̩͚͉͈̺̺͔̥͈̯̪͚̱͔̹̺͇̩̣̙͎͉̝̞̫̪̘͕͕̰̥̼̙̻͕͔͖̳̺̙̳̙̤̬̱͇͈̦̦̼̯̮͙̼͎̫̜͈̤̮̣̲̣̠̠̻̫͓̼͎̹̣͓̰̩̤͈̰̝̟̭͇͕̰̮͖̩̗͇͈̻͖͇͓̮̦̘̼̘͓̱̖̫̥̳͈̦͇͖̬͔̙͖̠̜̹̤̹̰͕̹̥̪̟̯͖͉̘̜̹̦̪̌̊͐̌̿̋̈̔̒̈́̾́̓̈́́͐̆̓̾́̇̃͊̓̆͋̿͑̌͊́͊͋̋͊̌̂̇͑̑̽͂̏̈́̀͋̂̈́̈́̀͂̅̑̔͑̉̃̓͗͛̓̋̽̀̒̿̈́̋̆̾̃̿̿̂̀̃̒̆̓̐̀͗̏͊̈́̈̀͒̇̄͋̏̒̊̽̓̍̑͐́̽̐͒̅̎́́̈̃̎͋̅̅̉̾́́̀̄̌̌́͛̽͛͋͐͒̔̈́̉̅̑͒̐͗̍̌͐̈́̏̆̈́̄͌̒̈͑͑̉̒͐̆̓̇͌̐̌̃̐̒͆̈́͑̑͊̈͋͗̽́̒̽̀̔̀̈̀̓̽̏̊͑̽̋̃͊́̀̓̏̌̓̈́̒̅̃̍̏̇̍̽̊̈̊̎̆̉̂̃̉̃̏̎͆̈̏̃̂͂̈́̉̽̃͛̋̈́͂̕̚͘̕̕͘̕͘͘̚̕̕͘̕͘̚̚͜͜͜͝͝͝͝͝͠͠͝͝͝͝͠͝͝͠͝͝ͅͅͅxxxcxxỈ̶̡̢̛̛̛̜̞̗̜͈͖̤̮̰̫͙͚̙͈͎̼͚͍͍̺̦̯̱̟̫̭͕̭͉͉̃̈́͂̾̎̌̒͊̀̄̍̈̽̓̽̂̌͐̈́͒̆͌̈́͂̐̐̎́̑͛̍͛̐̋͛̌̋̃̄̂͗̈̉͋̏̽̚̚̚͝xxxixxĮ̵̨̧̡̡̡̡̧̡̧̢̡̡̨̨̢̨̛̛̛̛̛̛̛̛̛͎̠̺̦͕̯̯̻͉̱͎̠̣̼̫̳̤̦̯̣̯̼̠̱͈̙̫̘̼̜̳͔̭̗̱̯̝̗̼̞̮̺̻̥͉̦̻͕̱͉̘̝̲̯̗̟͇̻̫̫̼̠͙̤͔̪̫̟͖̩͚͉͈̺̺͔̥͈̯̪͚̱͔̹̺͇̩̣̙͎͉̝̞̫̪̘͕͕̰̥̼̙̻͕͔͖̳̺̙̳̙̤̬̱͇͈̦̦̼̯̮͙̼͎̫̜͈̤̮̣̲̣̠̠̻̫͓̼͎̹̣͓̰̩̤͈̰̝̟̭͇͕̰̮͖̩̗͇͈̻͖͇͓̮̦̘̼̘͓̱̖̫̥̳͈̦͇͖̬͔̙͖̠̜̹̤̹̰͕̹̥̪̟̯͖͉̘̜̹̦̪̌̊͐̌̿̋̈̔̒̈́̾́̓̈́́͐̆̓̾́̇̃͊̓̆͋̿͑̌͊́͊͋̋͊̌̂̇͑̑̽͂̏̈́̀͋̂̈́̈́̀͂̅̑̔͑̉̃̓͗͛̓̋̽̀̒̿̈́̋̆̾̃̿̿̂̀̃̒̆̓̐̀͗̏͊̈́̈̀͒̇̄͋̏̒̊̽̓̍̑͐́̽̐͒̅̎́́̈̃̎͋̅̅̉̾́́̀̄̌̌́͛̽͛͋͐͒̔̈́̉̅̑͒̐͗̍̌͐̈́̏̆̈́̄͌̒̈͑͑̉̒͐̆̓̇͌̐̌̃̐̒͆̈́͑̑͊̈͋͗̽́̒̽̀̔̀̈̀̓̽̏̊͑̽̋̃͊́̀̓̏̌̓̈́̒̅̃̍̏̇̍̽̊̈̊̎̆̉̂̃̉̃̏̎͆̈̏̃̂͂̈́̉̽̃͛̋̈́͂̕̚͘̕̕͘̕͘͘̚̕̕͘̕͘̚̚͜͜͜͝͝͝͝͝͠͠͝͝͝͝͠͝͝͠͝͝ͅͅͅĮ̵̨̧̡̡̡̡̧̡̧̢̡̡̨̨̢̨̡̨̡̢̡̢̢̛̛̛̛̛̛̛̛̛͎̠̺̦͕̯̯̻͉̱͎̠̣̼̫̳̤̦̯̣̯̼̠̱͈̙̫̘̼̜̳͔̭̗̱̯̝̗̼̞̮̺̻̥͉̦̻͕̱͉̘̝̲̯̗̟͇̻̫̫̼̠͙̤͔̪̫̟͖̩͚͉͈̺̺͔̥͈̯̪͚̱͔̹̺͇̩̣̙͎͉̝̞̫̪̘͕͕̰̥̼̙̻͕͔͖̳̺̙̳̙̤̬̱͇͈̦̦̼̯̮͙̼͎̫̜͈̤̮̣̲̣̠̠̻̫͓̼͎̹̣͓̰̩̤͈̰̝̟̭͇͕̰̮͖̩̗͇͈̻͖͇͓̮̦̘̼̘͓̱̖̫̥̳͈̦͇͖̬͔̙͖̠̜̹̤̹̰͕̹̥̪̟̯͖͉̘̜̹̦̪̲̹͕̙̫̘͓̦̝̘̫̟̖̥̬̫̞͚̺̱͚̯̗̩̮̠̲̘͕͙̘̙̪͖͚̼͈̞̱̣̞̭̝̟̌̊͐̌̿̋̈̔̒̈́̾́̓̈́́͐̆̓̾́̇̃͊̓̆͋̿͑̌͊́͊͋̋͊̌̂̇͑̑̽͂̏̈́̀͋̂̈́̈́̀͂̅̑̔͑̉̃̓͗͛̓̋̽̀̒̿̈́̋̆̾̃̿̿̂̀̃̒̆̓̐̀͗̏͊̈́̈̀͒̇̄͋̏̒̊̽̓̍̑͐́̽̐͒̅̎́́̈̃̎͋̅̅̉̾́́̀̄̌̌́͛̽͛͋͐͒̔̈́̉̅̑͒̐͗̍̌͐̈́̏̆̈́̄͌̒̈͑͑̉̒͐̆̓̇͌̐̌̃̐̒͆̈́͑̑͊̈͋͗̽́̒̽̀̔̀̈̀̓̽̏̊͑̽̋̃͊́̀̓̏̌̓̈́̒̅̃̍̏̇̍̽̊̈̊̎̆̉̂̃̉̃̏̎͆̈̏̃̂͂̈́̉̽̃͛̋̈́͂̕̚͘̕̕͘̕͘͘̚̕̕͘̕͘̚̚͜͜͜͝͝͝͝͝͠͠͝͝͝͝͠͝͝͠͝͝ͅͅͅĮ̵̨̧̡̡̡̡̧̡̧̢̡̡̨̨̢̨̡̨̡̢̡̢̢̛̛̛̛̛̛̛̛̛͎̠̺̦͕̯̯̻͉̱͎̠̣̼̫̳̤̦̯̣̯̼̠̱͈̙̫̘̼̜̳͔̭̗̱̯̝̗̼̞̮̺̻̥͉̦̻͕̱͉̘̝̲̯̗̟͇̻̫̫̼̠͙̤͔̪̫̟͖̩͚͉͈̺̺͔̥͈̯̪͚̱͔̹̺͇̩̣̙͎͉̝̞̫̪̘͕͕̰̥̼̙̻͕͔͖̳̺̙̳̙̤̬̱͇͈̦̦̼̯̮͙̼͎̫̜͈̤̮̣̲̣̠̠̻̫͓̼͎̹̣͓̰̩̤͈̰̝̟̭͇͕̰̮͖̩̗͇͈̻͖͇͓̮̦̘̼̘͓̱̖̫̥̳͈̦͇͖̬͔̙͖̠̜̹̤̹̰͕̹̥̪̟̯͖͉̘̜̹̦̪̲̹͕̙̫̘͓̦̝̘̫̟̖̥̬̫̞͚̺̱͚̯̗̩̮̠̲̘͕͙̘̙̪͖͚̼͈̞̱̣̞̭̝̟̌̊͐̌̿̋̈̔̒̈́̾́̓̈́́͐̆̓̾́̇̃͊̓̆͋̿͑̌͊́͊͋̋͊̌̂̇͑̑̽͂̏̈́̀͋̂̈́̈́̀͂̅̑̔͑̉̃̓͗͛̓̋̽̀̒̿̈́̋̆̾̃̿̿̂̀̃̒̆̓̐̀͗̏͊̈́̈̀͒̇̄͋̏̒̊̽̓̍̑͐́̽̐͒̅̎́́̈̃̎͋̅̅̉̾́́̀̄̌̌́͛̽͛͋͐͒̔̈́̉̅̑͒̐͗̍̌͐̈́̏̆̈́̄͌̒̈͑͑̉̒͐̆̓̇͌̐̌̃̐̒͆̈́͑̑͊̈͋͗̽́̒̽̀̔̀̈̀̓̽̏̊͑̽̋̃͊́̀̓̏̌̓̈́̒̅̃̍̏̇̍̽̊̈̊̎̆̉̂̃̉̃̏̎͆̈̏̃̂͂̈́̉̽̃͛̋̈́͂̕̚͘̕̕͘̕͘͘̚̕̕͘̕͘̚̚͜͜͜͝͝͝͝͝͠͠͝͝͝͝͠͝͝͠͝͝ͅͅͅxxxixxxzzzxxxxxxĮ̵̧̢̡̡̧̡̛̛̪͖̖̣̥̟͓̣̲̗̬̰̼̤̹͙̙̥̺͚͇̗̳̣̙̯̮̝̥̲̹͍͙̮̞̤̟̭̪͈̻̬̞̖͚͖͉̤͉͇͖̯̭̪̩̩̻̳̤̮̳̻͔̦̦͚̒͆̍͌̈̽̊͋̅̽̽̈́͂́̈́̃̀̔͌̍̉̏̇͂̈́͐̃̓́̉̎̌̓́̌̃͌͗́̑͗̄͋͒̋͊̿̊̊̅̕͝͠͠͝͠͠͠ͅͅĮ̵̧̢̡̡̧̡̛̛̪͖̖̣̥̟͓̣̲̗̬̰̼̤̹͙̙̥̺͚͇̗̳̣̙̯̮̝̥̲̹͍͙̮̞̤̟̭̪͈̻̬̞̖͚͖͉̤͉͇͖̯̭̪̩̩̻̳̤̮̳̻͔̦̦͚̒͆̍͌̈̽̊͋̅̽̽̈́͂́̈́̃̀̔͌̍̉̏̇͂̈́͐̃̓́̉̎̌̓́̌̃͌͗́̑͗̄͋͒̋͊̿̊̊̅̕͝͠͠͝͠͠͠ͅͅĮ̵̨̧̡̡̡̡̧̡̧̢̡̡̨̨̢̨̡̨̡̢̡̢̢̛̛̛̛̛̛̛̛̛͎̠̺̦͕̯̯̻͉̱͎̠̣̼̫̳̤̦̯̣̯̼̠̱͈̙̫̘̼̜̳͔̭̗̱̯̝̗̼̞̮̺̻̥͉̦̻͕̱͉̘̝̲̯̗̟͇̻̫̫̼̠͙̤͔̪̫̟͖̩͚͉͈̺̺͔̥͈̯̪͚̱͔̹̺͇̩̣̙͎͉̝̞̫̪̘͕͕̰̥̼̙̻͕͔͖̳̺̙̳̙̤̬̱͇͈̦̦̼̯̮͙̼͎̫̜͈̤̮̣̲̣̠̠̻̫͓̼͎̹̣͓̰̩̤͈̰̝̟̭͇͕̰̮͖̩̗͇͈̻͖͇͓̮̦̘̼̘͓̱̖̫̥̳͈̦͇͖̬͔̙͖̠̜̹̤̹̰͕̹̥̪̟̯͖͉̘̜̹̦̪̲̹͕̙̫̘͓̦̝̘̫̟̖̥̬̫̞͚̺̱͚̯̗̩̮̠̲̘͕͙̘̙̪͖͚̼͈̞̱̣̞̭̝̟̌̊͐̌̿̋̈̔̒̈́̾́̓̈́́͐̆̓̾́̇̃͊̓̆͋̿͑̌͊́͊͋̋͊̌̂̇͑̑̽͂̏̈́̀͋̂̈́̈́̀͂̅̑̔͑̉̃̓͗͛̓̋̽̀̒̿̈́̋̆̾̃̿̿̂̀̃̒̆̓̐̀͗̏͊̈́̈̀͒̇̄͋̏̒̊̽̓̍̑͐́̽̐͒̅̎́́̈̃̎͋̅̅̉̾́́̀̄̌̌́͛̽͛͋͐͒̔̈́̉̅̑͒̐͗̍̌͐̈́̏̆̈́̄͌̒̈͑͑̉̒͐̆̓̇͌̐̌̃̐̒͆̈́͑̑͊̈͋͗̽́̒̽̀̔̀̈̀̓̽̏̊͑̽̋̃͊́̀̓̏̌̓̈́̒̅̃̍̏̇̍̽̊̈̊̎̆̉̂̃̉̃̏̎͆̈̏̃̂͂̈́̉̽̃͛̋̈́͂̕̚͘̕̕͘̕͘͘̚̕̕͘̕͘̚̚͜͜͜͝͝͝͝͝͠͠͝͝͝͝͠͝͝͠͝͝ͅͅͅ[xĮ̵̨̧̡̡̡̡̧̡̧̢̡̡̨̨̢̨̛̛̛̛̛̛̛̛̛͎̠̺̦͕̯̯̻͉̱͎̠̣̼̫̳̤̦̯̣̯̼̠̱͈̙̫̘̼̜̳͔̭̗̱̯̝̗̼̞̮̺̻̥͉̦̻͕̱͉̘̝̲̯̗̟͇̻̫̫̼̠͙̤͔̪̫̟͖̩͚͉͈̺̺͔̥͈̯̪͚̱͔̹̺͇̩̣̙͎͉̝̞̫̪̘͕͕̰̥̼̙̻͕͔͖̳̺̙̳̙̤̬̱͇͈̦̦̼̯̮͙̼͎̫̜͈̤̮̣̲̣̠̠̻̫͓̼͎̹̣͓̰̩̤͈̰̝̟̭͇͕̰̮͖̩̗͇͈̻͖͇͓̮̦̘̼̘͓̱̖̫̥̳͈̦͇͖̬͔̙͖̠̜̹̤̹̰͕̹̥̪̟̯͖͉̘̜̹̦̪̌̊͐̌̿̋̈̔̒̈́̾́̓̈́́͐̆̓̾́̇̃͊̓̆͋̿͑̌͊́͊͋̋͊̌̂̇͑̑̽͂̏̈́̀͋̂̈́̈́̀͂̅̑̔͑̉̃̓͗͛̓̋̽̀̒̿̈́̋̆̾̃̿̿̂̀̃̒̆̓̐̀͗̏͊̈́̈̀͒̇̄͋̏̒̊̽̓̍̑͐́̽̐͒̅̎́́̈̃̎͋̅̅̉̾́́̀̄̌̌́͛̽͛͋͐͒̔̈́̉̅̑͒̐͗̍̌͐̈́̏̆̈́̄͌̒̈͑͑̉̒͐̆̓̇͌̐̌̃̐̒͆̈́͑̑͊̈͋͗̽́̒̽̀̔̀̈̀̓̽̏̊͑̽̋̃͊́̀̓̏̌̓̈́̒̅̃̍̏̇̍̽̊̈̊̎̆̉̂̃̉̃̏̎͆̈̏̃̂͂̈́̉̽̃͛̋̈́͂̕̚͘̕̕͘̕͘͘̚̕̕͘̕͘̚̚͜͜͜͝͝͝͝͝͠͠͝͝͝͝͠͝͝͠͝͝ͅͅͅĮ̵̧̢̡̡̧̡̛̛̪͖̖̣̥̟͓̣̲̗̬̰̼̤̹͙̙̥̺͚͇̗̳̣̙̯̮̝̥̲̹͍͙̮̞̤̟̭̪͈̻̬̞̖͚͖͉̤͉͇͖̯̭̪̩̩̻̳̤̮̳̻͔̦̦͚̒͆̍͌̈̽̊͋̅̽̽̈́͂́̈́̃̀̔͌̍̉̏̇͂̈́͐̃̓́̉̎̌̓́̌̃͌͗́̑͗̄͋͒̋͊̿̊̊̅̕͝͠͠͝͠͠͠ͅͅĮ̵̧̢̡̡̧̡̛̛̪͖̖̣̥̟͓̣̲̗̬̰̼̤̹͙̙̥̺͚͇̗̳̣̙̯̮̝̥̲̹͍͙̮̞̤̟̭̪͈̻̬̞̖͚͖͉̤͉͇͖̯̭̪̩̩̻̳̤̮̳̻͔̦̦͚̒͆̍͌̈̽̊͋̅̽̽̈́͂́̈́̃̀̔͌̍̉̏̇͂̈́͐̃̓́̉̎̌̓́̌̃͌͗́̑͗̄͋͒̋͊̿̊̊̅̕͝͠͠͝͠͠͠ͅͅ[xĮ̵̨̧̡̡̡̡̧̡̧̢̡̡̨̨̢̨̛̛̛̛̛̛̛̛̛͎̠̺̦͕̯̯̻͉̱͎̠̣̼̫̳̤̦̯̣̯̼̠̱͈̙̫̘̼̜̳͔̭̗̱̯̝̗̼̞̮̺̻̥͉̦̻͕̱͉̘̝̲̯̗̟͇̻̫̫̼̠͙̤͔̪̫̟͖̩͚͉͈̺̺͔̥͈̯̪͚̱͔̹̺͇̩̣̙͎͉̝̞̫̪̘͕͕̰̥̼̙̻͕͔͖̳̺̙̳̙̤̬̱͇͈̦̦̼̯̮͙̼͎̫̜͈̤̮̣̲̣̠̠̻̫͓̼͎̹̣͓̰̩̤͈̰̝̟̭͇͕̰̮͖̩̗͇͈̻͖͇͓̮̦̘̼̘͓̱̖̫̥̳͈̦͇͖̬͔̙͖̠̜̹̤̹̰͕̹̥̪̟̯͖͉̘̜̹̦̪̌̊͐̌̿̋̈̔̒̈́̾́̓̈́́͐̆̓̾́̇̃͊̓̆͋̿͑̌͊́͊͋̋͊̌̂̇͑̑̽͂̏̈́̀͋̂̈́̈́̀͂̅̑̔͑̉̃̓͗͛̓̋̽̀̒̿̈́̋̆̾̃̿̿̂̀̃̒̆̓̐̀͗̏͊̈́̈̀͒̇̄͋̏̒̊̽̓̍̑͐́̽̐͒̅̎́́̈̃̎͋̅̅̉̾́́̀̄̌̌́͛̽͛͋͐͒̔̈́̉̅̑͒̐͗̍̌͐̈́̏̆̈́̄͌̒̈͑͑̉̒͐̆̓̇͌̐̌̃̐̒͆̈́͑̑͊̈͋͗̽́̒̽̀̔̀̈̀̓̽̏̊͑̽̋̃͊́̀̓̏̌̓̈́̒̅̃̍̏̇̍̽̊̈̊̎̆̉̂̃̉̃̏̎͆̈̏̃̂͂̈́̉̽̃͛̋̈́͂̕̚͘̕̕͘̕͘͘̚̕̕͘̕͘̚̚͜͜͜͝͝͝͝͝͠͠͝͝͝͝͠͝͝͠͝͝ͅͅͅĮ̵̨̧̡̡̡̡̧̡̧̢̡̡̨̨̢̨̡̨̡̢̡̢̢̛̛̛̛̛̛̛̛̛͎̠̺̦͕̯̯̻͉̱͎̠̣̼̫̳̤̦̯̣̯̼̠̱͈̙̫̘̼̜̳͔̭̗̱̯̝̗̼̞̮̺̻̥͉̦̻͕̱͉̘̝̲̯̗̟͇̻̫̫̼̠͙̤͔̪̫̟͖̩͚͉͈̺̺͔̥͈̯̪͚̱͔̹̺͇̩̣̙͎͉̝̞̫̪̘͕͕̰̥̼̙̻͕͔͖̳̺̙̳̙̤̬̱͇͈̦̦̼̯̮͙̼͎̫̜͈̤̮̣̲̣̠̠̻̫͓̼͎̹̣͓̰̩̤͈̰̝̟̭͇͕̰̮͖̩̗͇͈̻͖͇͓̮̦̘̼̘͓̱̖̫̥̳͈̦͇͖̬͔̙͖̠̜̹̤̹̰͕̹̥̪̟̯͖͉̘̜̹̦̪̲̹͕̙̫̘͓̦̝̘̫̟̖̥̬̫̞͚̺̱͚̯̗̩̮̠̲̘͕͙̘̙̪͖͚̼͈̞̱̣̞̭̝̟̌̊͐̌̿̋̈̔̒̈́̾́̓̈́́͐̆̓̾́̇̃͊̓̆͋̿͑̌͊́͊͋̋͊̌̂̇͑̑̽͂̏̈́̀͋̂̈́̈́̀͂̅̑̔͑̉̃̓͗͛̓̋̽̀̒̿̈́̋̆̾̃̿̿̂̀̃̒̆̓̐̀͗̏͊̈́̈̀͒̇̄͋̏̒̊̽̓̍̑͐́̽̐͒̅̎́́̈̃̎͋̅̅̉̾́́̀̄̌̌́͛̽͛͋͐͒̔̈́̉̅̑͒̐͗̍̌͐̈́̏̆̈́̄͌̒̈͑͑̉̒͐̆̓̇͌̐̌̃̐̒͆̈́͑̑͊̈͋͗̽́̒̽̀̔̀̈̀̓̽̏̊͑̽̋̃͊́̀̓̏̌̓̈́̒̅̃̍̏̇̍̽̊̈̊̎̆̉̂̃̉̃̏̎͆̈̏̃̂͂̈́̉̽̃͛̋̈́͂̕̚͘̕̕͘̕͘͘̚̕̕͘̕͘̚̚͜͜͜͝͝͝͝͝͠͠͝͝͝͝͠͝͝͠͝͝ͅͅͅĮ̵̨̧̡̡̡̡̧̡̧̢̡̡̨̨̢̨̡̨̡̢̡̢̢̛̛̛̛̛̛̛̛̛͎̠̺̦͕̯̯̻͉̱͎̠̣̼̫̳̤̦̯̣̯̼̠̱͈̙̫̘̼̜̳͔̭̗̱̯̝̗̼̞̮̺̻̥͉̦̻͕̱͉̘̝̲̯̗̟͇̻̫̫̼̠͙̤͔̪̫̟͖̩͚͉͈̺̺͔̥͈̯̪͚̱͔̹̺͇̩̣̙͎͉̝̞̫̪̘͕͕̰̥̼̙̻͕͔͖̳̺̙̳̙̤̬̱͇͈̦̦̼̯̮͙̼͎̫̜͈̤̮̣̲̣̠̠̻̫͓̼͎̹̣͓̰̩̤͈̰̝̟̭͇͕̰̮͖̩̗͇͈̻͖͇͓̮̦̘̼̘͓̱̖̫̥̳͈̦͇͖̬͔̙͖̠̜̹̤̹̰͕̹̥̪̟̯͖͉̘̜̹̦̪̲̹͕̙̫̘͓̦̝̘̫̟̖̥̬̫̞͚̺̱͚̯̗̩̮̠̲̘͕͙̘̙̪͖͚̼͈̞̱̣̞̭̝̟̌̊͐̌̿̋̈̔̒̈́̾́̓̈́́͐̆̓̾́̇̃͊̓̆͋̿͑̌͊́͊͋̋͊̌̂̇͑̑̽͂̏̈́̀͋̂̈́̈́̀͂̅̑̔͑̉̃̓͗͛̓̋̽̀̒̿̈́̋̆̾̃̿̿̂̀̃̒̆̓̐̀͗̏͊̈́̈̀͒̇̄͋̏̒̊̽̓̍̑͐́̽̐͒̅̎́́̈̃̎͋̅̅̉̾́́̀̄̌̌́͛̽͛͋͐͒̔̈́̉̅̑͒̐͗̍̌͐̈́̏̆̈́̄͌̒̈͑͑̉̒͐̆̓̇͌̐̌̃̐̒͆̈́͑̑͊̈͋͗̽́̒̽̀̔̀̈̀̓̽̏̊͑̽̋̃͊́̀̓̏̌̓̈́̒̅̃̍̏̇̍̽̊̈̊̎̆̉̂̃̉̃̏̎͆̈̏̃̂͂̈́̉̽̃͛̋̈́͂̕̚͘̕̕͘̕͘͘̚̕̕͘̕͘̚̚͜͜͜͝͝͝͝͝͠͠͝͝͝͝͠͝͝͠͝͝ͅͅͅ[xizĮ̵̨̧̡̡̡̡̧̡̧̢̡̡̨̨̢̨̛̛̛̛̛̛̛̛̛͎̠̺̦͕̯̯̻͉̱͎̠̣̼̫̳̤̦̯̣̯̼̠̱͈̙̫̘̼̜̳͔̭̗̱̯̝̗̼̞̮̺̻̥͉̦̻͕̱͉̘̝̲̯̗̟͇̻̫̫̼̠͙̤͔̪̫̟͖̩͚͉͈̺̺͔̥͈̯̪͚̱͔̹̺͇̩̣̙͎͉̝̞̫̪̘͕͕̰̥̼̙̻͕͔͖̳̺̙̳̙̤̬̱͇͈̦̦̼̯̮͙̼͎̫̜͈̤̮̣̲̣̠̠̻̫͓̼͎̹̣͓̰̩̤͈̰̝̟̭͇͕̰̮͖̩̗͇͈̻͖͇͓̮̦̘̼̘͓̱̖̫̥̳͈̦͇͖̬͔̙͖̠̜̹̤̹̰͕̹̥̪̟̯͖͉̘̜̹̦̪̌̊͐̌̿̋̈̔̒̈́̾́̓̈́́͐̆̓̾́̇̃͊̓̆͋̿͑̌͊́͊͋̋͊̌̂̇͑̑̽͂̏̈́̀͋̂̈́̈́̀͂̅̑̔͑̉̃̓͗͛̓̋̽̀̒̿̈́̋̆̾̃̿̿̂̀̃̒̆̓̐̀͗̏͊̈́̈̀͒̇̄͋̏̒̊̽̓̍̑͐́̽̐͒̅̎́́̈̃̎͋̅̅̉̾́́̀̄̌̌́͛̽͛͋͐͒̔̈́̉̅̑͒̐͗̍̌͐̈́̏̆̈́̄͌̒̈͑͑̉̒͐̆̓̇͌̐̌̃̐̒͆̈́͑̑͊̈͋͗̽́̒̽̀̔̀̈̀̓̽̏̊͑̽̋̃͊́̀̓̏̌̓̈́̒̅̃̍̏̇̍̽̊̈̊̎̆̉̂̃̉̃̏̎͆̈̏̃̂͂̈́̉̽̃͛̋̈́͂̕̚͘̕̕͘̕͘͘̚̕̕͘̕͘̚̚͜͜͜͝͝͝͝͝͠͠͝͝͝͝͠͝͝͠͝͝ͅͅͅĮ̵̨̧̡̡̡̡̧̡̧̢̡̡̨̨̢̨̡̨̡̢̡̢̢̛̛̛̛̛̛̛̛̛͎̠̺̦͕̯̯̻͉̱͎̠̣̼̫̳̤̦̯̣̯̼̠̱͈̙̫̘̼̜̳͔̭̗̱̯̝̗̼̞̮̺̻̥͉̦̻͕̱͉̘̝̲̯̗̟͇̻̫̫̼̠͙̤͔̪̫̟͖̩͚͉͈̺̺͔̥͈̯̪͚̱͔̹̺͇̩̣̙͎͉̝̞̫̪̘͕͕̰̥̼̙̻͕͔͖̳̺̙̳̙̤̬̱͇͈̦̦̼̯̮͙̼͎̫̜͈̤̮̣̲̣̠̠̻̫͓̼͎̹̣͓̰̩̤͈̰̝̟̭͇͕̰̮͖̩̗͇͈̻͖͇͓̮̦̘̼̘͓̱̖̫̥̳͈̦͇͖̬͔̙͖̠̜̹̤̹̰͕̹̥̪̟̯͖͉̘̜̹̦̪̲̹͕̙̫̘͓̦̝̘̫̟̖̥̬̫̞͚̺̱͚̯̗̩̮̠̲̘͕͙̘̙̪͖͚̼͈̞̱̣̞̭̝̟̌̊͐̌̿̋̈̔̒̈́̾́̓̈́́͐̆̓̾́̇̃͊̓̆͋̿͑̌͊́͊͋̋͊̌̂̇͑̑̽͂̏̈́̀͋̂̈́̈́̀͂̅̑̔͑̉̃̓͗͛̓̋̽̀̒̿̈́̋̆̾̃̿̿̂̀̃̒̆̓̐̀͗̏͊̈́̈̀͒̇̄͋̏̒̊̽̓̍̑͐́̽̐͒̅̎́́̈̃̎͋̅̅̉̾́́̀̄̌̌́͛̽͛͋͐͒̔̈́̉̅̑͒̐͗̍̌͐̈́̏̆̈́̄͌̒̈͑͑̉̒͐̆̓̇͌̐̌̃̐̒͆̈́͑̑͊̈͋͗̽́̒̽̀̔̀̈̀̓̽̏̊͑̽̋̃͊́̀̓̏̌̓̈́̒̅̃̍̏̇̍̽̊̈̊̎̆̉̂̃̉̃̏̎͆̈̏̃̂͂̈́̉̽̃͛̋̈́͂̕̚͘̕̕͘̕͘͘̚̕̕͘̕͘̚̚͜͜͜͝͝͝͝͝͠͠͝͝͝͝͠͝͝͠͝͝ͅͅͅĮ̵̨̧̡̡̡̡̧̡̧̢̡̡̨̨̢̨̡̨̡̢̡̢̢̛̛̛̛̛̛̛̛̛͎̠̺̦͕̯̯̻͉̱͎̠̣̼̫̳̤̦̯̣̯̼̠̱͈̙̫̘̼̜̳͔̭̗̱̯̝̗̼̞̮̺̻̥͉̦̻͕̱͉̘̝̲̯̗̟͇̻̫̫̼̠͙̤͔̪̫̟͖̩͚͉͈̺̺͔̥͈̯̪͚̱͔̹̺͇̩̣̙͎͉̝̞̫̪̘͕͕̰̥̼̙̻͕͔͖̳̺̙̳̙̤̬̱͇͈̦̦̼̯̮͙̼͎̫̜͈̤̮̣̲̣̠̠̻̫͓̼͎̹̣͓̰̩̤͈̰̝̟̭͇͕̰̮͖̩̗͇͈̻͖͇͓̮̦̘̼̘͓̱̖̫̥̳͈̦͇͖̬͔̙͖̠̜̹̤̹̰͕̹̥̪̟̯͖͉̘̜̹̦̪̲̹͕̙̫̘͓̦̝̘̫̟̖̥̬̫̞͚̺̱͚̯̗̩̮̠̲̘͕͙̘̙̪͖͚̼͈̞̱̣̞̭̝̟̌̊͐̌̿̋̈̔̒̈́̾́̓̈́́͐̆̓̾́̇̃͊̓̆͋̿͑̌͊́͊͋̋͊̌̂̇͑̑̽͂̏̈́̀͋̂̈́̈́̀͂̅̑̔͑̉̃̓͗͛̓̋̽̀̒̿̈́̋̆̾̃̿̿̂̀̃̒̆̓̐̀͗̏͊̈́̈̀͒̇̄͋̏̒̊̽̓̍̑͐́̽̐͒̅̎́́̈̃̎͋̅̅̉̾́́̀̄̌̌́͛̽͛͋͐͒̔̈́̉̅̑͒̐͗̍̌͐̈́̏̆̈́̄͌̒̈͑͑̉̒͐̆̓̇͌̐̌̃̐̒͆̈́͑̑͊̈͋͗̽́̒̽̀̔̀̈̀̓̽̏̊͑̽̋̃͊́̀̓̏̌̓̈́̒̅̃̍̏̇̍̽̊̈̊̎̆̉̂̃̉̃̏̎͆̈̏̃̂͂̈́̉̽̃͛̋̈́͂̕̚͘̕̕͘̕͘͘̚̕̕͘̕͘̚̚͜͜͜͝͝͝͝͝͠͠͝͝͝͝͠͝͝͠͝͝ͅͅͅ[
/̷͉̥̒̈̊̅̓̃̾̈̇́\̴̨̨̜̺̝̦̠̓͘
*̶̢̣̙̳͕̐̐̿̌
ii\̴̨̨̜̺̝̦̠̓͘/̷͉̥̒̈̊̅̓̃̾̈̇́
Į̵̨̧̡̡̡̡̧̡̧̢̡̡̨̨̢̨̡̨̡̢̡̢̢̛̛̛̛̛̛̛̛̛͎̠̺̦͕̯̯̻͉̱͎̠̣̼̫̳̤̦̯̣̯̼̠̱͈̙̫̘̼̜̳͔̭̗̱̯̝̗̼̞̮̺̻̥͉̦̻͕̱͉̘̝̲̯̗̟͇̻̫̫̼̠͙̤͔̪̫̟͖̩͚͉͈̺̺͔̥͈̯̪͚̱͔̹̺͇̩̣̙͎͉̝̞̫̪̘͕͕̰̥̼̙̻͕͔͖̳̺̙̳̙̤̬̱͇͈̦̦̼̯̮͙̼͎̫̜͈̤̮̣̲̣̠̠̻̫͓̼͎̹̣͓̰̩̤͈̰̝̟̭͇͕̰̮͖̩̗͇͈̻͖͇͓̮̦̘̼̘͓̱̖̫̥̳͈̦͇͖̬͔̙͖̠̜̹̤̹̰͕̹̥̪̟̯͖͉̘̜̹̦̪̲̹͕̙̫̘͓̦̝̘̫̟̖̥̬̫̞͚̺̱͚̯̗̩̮̠̲̘͕͙̘̙̪͖͚̼͈̞̱̣̞̭̝̟̌̊͐̌̿̋̈̔̒̈́̾́̓̈́́͐̆̓̾́̇̃͊̓̆͋̿͑̌͊́͊͋̋͊̌̂̇͑̑̽͂̏̈́̀͋̂̈́̈́̀͂̅̑̔͑̉̃̓͗͛̓̋̽̀̒̿̈́̋̆̾̃̿̿̂̀̃̒̆̓̐̀͗̏͊̈́̈̀͒̇̄͋̏̒̊̽̓̍̑͐́̽̐͒̅̎́́̈̃̎͋̅̅̉̾́́̀̄̌̌́͛̽͛͋͐͒̔̈́̉̅̑͒̐͗̍̌͐̈́̏̆̈́̄͌̒̈͑͑̉̒͐̆̓̇͌̐̌̃̐̒͆̈́͑̑͊̈͋͗̽́̒̽̀̔̀̈̀̓̽̏̊͑̽̋̃͊́̀̓̏̌̓̈́̒̅̃̍̏̇̍̽̊̈̊̎̆̉̂̃̉̃̏̎͆̈̏̃̂͂̈́̉̽̃͛̋̈́͂̕̚͘̕̕͘̕͘͘̚̕̕͘̕͘̚̚͜͜͜͝͝͝͝͝͠͠͝͝͝͝͠͝͝͠͝͝ͅͅͅ
xxĮ̵̨̧̡̡̡̡̧̡̧̢̡̡̨̨̢̨̡̨̡̢̡̢̢̛̛̛̛̛̛̛̛̛͎̠̺̦͕̯̯̻͉̱͎̠̣̼̫̳̤̦̯̣̯̼̠̱͈̙̫̘̼̜̳͔̭̗̱̯̝̗̼̞̮̺̻̥͉̦̻͕̱͉̘̝̲̯̗̟͇̻̫̫̼̠͙̤͔̪̫̟͖̩͚͉͈̺̺͔̥͈̯̪͚̱͔̹̺͇̩̣̙͎͉̝̞̫̪̘͕͕̰̥̼̙̻͕͔͖̳̺̙̳̙̤̬̱͇͈̦̦̼̯̮͙̼͎̫̜͈̤̮̣̲̣̠̠̻̫͓̼͎̹̣͓̰̩̤͈̰̝̟̭͇͕̰̮͖̩̗͇͈̻͖͇͓̮̦̘̼̘͓̱̖̫̥̳͈̦͇͖̬͔̙͖̠̜̹̤̹̰͕̹̥̪̟̯͖͉̘̜̹̦̪̲̹͕̙̫̘͓̦̝̘̫̟̖̥̬̫̞͚̺̱͚̯̗̩̮̠̲̘͕͙̘̙̪͖͚̼͈̞̱̣̞̭̝̟̌̊͐̌̿̋̈̔̒̈́̾́̓̈́́͐̆̓̾́̇̃͊̓̆͋̿͑̌͊́͊͋̋͊̌̂̇͑̑̽͂̏̈́̀͋̂̈́̈́̀͂̅̑̔͑̉̃̓͗͛̓̋̽̀̒̿̈́̋̆̾̃̿̿̂̀̃̒̆̓̐̀͗̏͊̈́̈̀͒̇̄͋̏̒̊̽̓̍̑͐́̽̐͒̅̎́́̈̃̎͋̅̅̉̾́́̀̄̌̌́͛̽͛͋͐͒̔̈́̉̅̑͒̐͗̍̌͐̈́̏̆̈́̄͌̒̈͑͑̉̒͐̆̓̇͌̐̌̃̐̒͆̈́͑̑͊̈͋͗̽́̒̽̀̔̀̈̀̓̽̏̊͑̽̋̃͊́̀̓̏̌̓̈́̒̅̃̍̏̇̍̽̊̈̊̎̆̉̂̃̉̃̏̎͆̈̏̃̂͂̈́̉̽̃͛̋̈́͂̕̚͘̕̕͘̕͘͘̚̕̕͘̕͘̚̚͜͜͜͝͝͝͝͝͠͠͝͝͝͝͠͝͝͠͝͝ͅͅͅ
z
z
z
z
z
z
z
z
-

Horror - Posts: 15760
- Joined: Thu Aug 19, 2010 6:42 am
- My pets
- My items
- My wishlist
- My gallery
- My scenes
- My dressups
- Trade with me
Re: [🐝] Guide to Trading Every Pet on CS -* Discussing! *
![]() by BlueEyedKite » Sat Oct 28, 2023 10:52 am
by BlueEyedKite » Sat Oct 28, 2023 10:52 am
It was a good answer! Very thorough. Now I can see why the guide may be under maintenance for a bit, if a piece to the puzzle is trade data. It's been slow going with trades, understandably, with the rarity update.
Trading had never been more fun for me than when your guide was active. I for one will be patient in hopes that it returns, better than ever. Thanks Horror
Trading had never been more fun for me than when your guide was active. I for one will be patient in hopes that it returns, better than ever. Thanks Horror
-
BlueEyedKite - Posts: 11780
- Joined: Thu May 28, 2009 9:38 am
- My pets
- My items
- My wishlist
- My gallery
- My scenes
- My dressups
- Trade with me
Re: [🐝] Guide to Trading Every Pet on CS -* Discussing! *
![]() by Mouse 13 » Sat Oct 28, 2023 3:48 pm
by Mouse 13 » Sat Oct 28, 2023 3:48 pm
I think one of the big problems we face is the math itself
Focusing on technical values doesn't take into account demand for the rarities themselves.
So, say I'm doing a trade with pets all of the same year, my partner wants one of my Rares. Now, my Rare is technically worth 2 Ext.Uncommons. An Ext.Uncommon is technically worth 2 VUcommons.
HOWEVER, No way am I trading a Rare for only 4 VUncommons!
I might even be a bit iffy about trading only 2 Ext.Uncommons for a Rare, as Rares are more sought after and much harder to trade for. For example, if someone offered me a Rare for my Rare, and another person offered me 2 Ext.Uncommons for the same Rare, I would choose the Rare for Rare trade every time... Which tells us that a rare isn't actually worth 2 Ext.Uncommons.
My point is, to figure out how many Ext.Uncommons a Rare is worth, it needs to be an amount that would make it hard to choose between a Rare : Rare trade and a Rare : (x)Ext.Uncommon trade.
And here's where math again is an issue on the true values: It would have to be an absurd amount of commons to make me accept a Rare : (x)Common trade. Way, way more than the technical value of them, no matter what sum you use to add them up to such through the rarity tiers.
If someone offered me 100 Commons for a Rare, I might still hesitate on that trade unless more than half of those were wishlist... and even then. People rarely if ever seek out Commons in trading, as 90% of them can be snagged in the free trades forum anyway, So 100 Commons would have no trading value to me, I would have a far easier time trading off the rare, even though the commons have a higher technical value, put together.
I'd like to share my personal trading rules in hopes it'll help out here, I came up with these by making hypothetical trades with myself and considering at what point I'd be willing to accept them.
OMGSC = OMG so common
ExC = Extremely common
VC = Very common
C = Common
UC = Uncommon
VUC = Very uncommon
ExUC = Extremely uncommon
R = Rare
VR = Very Rare
As you can see there's no math formula that can apply to these values, they're based solely on what I would accept, from either a trade up or trade down.
Also note that there's some comparisons left out- this is because I feel that the value can't be matched by lower rarity pets, no matter the quantity.
I've left out year math entirely, as it seems less relevant now that we've a more accurate grasp of how rare pets actually are.
Sorry for such a long post, and I hope this helps to update the guide :)
Focusing on technical values doesn't take into account demand for the rarities themselves.
So, say I'm doing a trade with pets all of the same year, my partner wants one of my Rares. Now, my Rare is technically worth 2 Ext.Uncommons. An Ext.Uncommon is technically worth 2 VUcommons.
HOWEVER, No way am I trading a Rare for only 4 VUncommons!
I might even be a bit iffy about trading only 2 Ext.Uncommons for a Rare, as Rares are more sought after and much harder to trade for. For example, if someone offered me a Rare for my Rare, and another person offered me 2 Ext.Uncommons for the same Rare, I would choose the Rare for Rare trade every time... Which tells us that a rare isn't actually worth 2 Ext.Uncommons.
My point is, to figure out how many Ext.Uncommons a Rare is worth, it needs to be an amount that would make it hard to choose between a Rare : Rare trade and a Rare : (x)Ext.Uncommon trade.
And here's where math again is an issue on the true values: It would have to be an absurd amount of commons to make me accept a Rare : (x)Common trade. Way, way more than the technical value of them, no matter what sum you use to add them up to such through the rarity tiers.
If someone offered me 100 Commons for a Rare, I might still hesitate on that trade unless more than half of those were wishlist... and even then. People rarely if ever seek out Commons in trading, as 90% of them can be snagged in the free trades forum anyway, So 100 Commons would have no trading value to me, I would have a far easier time trading off the rare, even though the commons have a higher technical value, put together.
I'd like to share my personal trading rules in hopes it'll help out here, I came up with these by making hypothetical trades with myself and considering at what point I'd be willing to accept them.
OMGSC = OMG so common
ExC = Extremely common
VC = Very common
C = Common
UC = Uncommon
VUC = Very uncommon
ExUC = Extremely uncommon
R = Rare
VR = Very Rare
- ExC = 2 OMGSC
VC = 2 ExC | 4 OMGSC
C = 2 VC | 4 ExC | 8 OMGSC
UC = 2 C | 5 VC | 12 ExC
VUC = 4 UC | 10 C | 20 VC
ExUC = 4 VUC | 10 UC
R = 4 ExUC | 10 VUC
VR = 5 R | 15 ExUC
As you can see there's no math formula that can apply to these values, they're based solely on what I would accept, from either a trade up or trade down.
Also note that there's some comparisons left out- this is because I feel that the value can't be matched by lower rarity pets, no matter the quantity.
I've left out year math entirely, as it seems less relevant now that we've a more accurate grasp of how rare pets actually are.
Sorry for such a long post, and I hope this helps to update the guide :)
.png)

.png)
.png)

.png)

.png)

.png)


-

Mouse 13 - Posts: 1164
- Joined: Thu Sep 28, 2017 4:33 pm
- My pets
- My items
- My wishlist
- My gallery
- My scenes
- My dressups
- Trade with me
Re: [🐝] Guide to Trading Every Pet on CS -* Discussing! *
![]() by SolarSonnet » Mon Oct 30, 2023 9:24 pm
by SolarSonnet » Mon Oct 30, 2023 9:24 pm
Mouse 13 wrote:I think one of the big problems we face is the math itself
Focusing on technical values doesn't take into account demand for the rarities themselves.
So, say I'm doing a trade with pets all of the same year, my partner wants one of my Rares. Now, my Rare is technically worth 2 Ext.Uncommons. An Ext.Uncommon is technically worth 2 VUcommons.
HOWEVER, No way am I trading a Rare for only 4 VUncommons!
I might even be a bit iffy about trading only 2 Ext.Uncommons for a Rare, as Rares are more sought after and much harder to trade for. For example, if someone offered me a Rare for my Rare, and another person offered me 2 Ext.Uncommons for the same Rare, I would choose the Rare for Rare trade every time... Which tells us that a rare isn't actually worth 2 Ext.Uncommons.
My point is, to figure out how many Ext.Uncommons a Rare is worth, it needs to be an amount that would make it hard to choose between a Rare : Rare trade and a Rare : (x)Ext.Uncommon trade.
And here's where math again is an issue on the true values: It would have to be an absurd amount of commons to make me accept a Rare : (x)Common trade. Way, way more than the technical value of them, no matter what sum you use to add them up to such through the rarity tiers.
If someone offered me 100 Commons for a Rare, I might still hesitate on that trade unless more than half of those were wishlist... and even then. People rarely if ever seek out Commons in trading, as 90% of them can be snagged in the free trades forum anyway, So 100 Commons would have no trading value to me, I would have a far easier time trading off the rare, even though the commons have a higher technical value, put together.
I'd like to share my personal trading rules in hopes it'll help out here, I came up with these by making hypothetical trades with myself and considering at what point I'd be willing to accept them.
OMGSC = OMG so common
ExC = Extremely common
VC = Very common
C = Common
UC = Uncommon
VUC = Very uncommon
ExUC = Extremely uncommon
R = Rare
VR = Very RareExC = 2 OMGSC
VC = 2 ExC | 4 OMGSC
C = 2 VC | 4 ExC | 8 OMGSC
UC = 2 C | 5 VC | 12 ExC
VUC = 4 UC | 10 C | 20 VC
ExUC = 4 VUC | 10 UC
R = 4 ExUC | 10 VUC
VR = 5 R | 15 ExUC
As you can see there's no math formula that can apply to these values, they're based solely on what I would accept, from either a trade up or trade down.
Also note that there's some comparisons left out- this is because I feel that the value can't be matched by lower rarity pets, no matter the quantity.
I've left out year math entirely, as it seems less relevant now that we've a more accurate grasp of how rare pets actually are.
Sorry for such a long post, and I hope this helps to update the guide
^ This is almost exactly how I feel!
The tag of "Rare" has it's own demand in and of itself, making it worth more than its "intended" or "fair" value.
So even if a chart or trade or guideline has a Rare be worth 4 VUC, it feels like trading a common lion for 4 common rats.(of the same year)
Or, trading a common lion for 2 common dogs feels like trading a rare for 2 EUC.
I.. just don't want the four common rats, or the two common dogs, unless they have a cool design or they're wishlist. The rats especially are harder to trade, and 9 times out of 10 I just like my lion better.
I've been through this analogy a couple of times and I don't think I'd even want 8 common rats for my lion, so maybe rats are more equivalent to our commons than uncommons. I might do 16 common rats for a common lion, but nobody wants to do that.
I'm also way more likely to accept a trade of another lion for my lion. Some people even put their lions in groups that say "only for others of the same species" because they don't want to receive anything else for their lions. In the same way that people say, "Rares for rares only"
The only thing I disagree with here, is the "Idk if I would accept 100 commons for my rare". There is value to bulk. Having 100 pets is going to be better in the long run than having 1 pet, unless all 100 of those pets are low-demand or an earlier year or something. I.E. I would not accept 100 Commons for my 2009 rare, even if all commons are worth 1 C$, and 100 commons are technically 100 C$ and an 09 rare is more like 40-50 C$, it'd be more work to trade off the commons that I wouldn't be willing to do.
-
I think it may be important to start to get rid of the "Rares+ have innate demand because of their rarity tag" mindset, though, as the EUC/VUC rarity tags have attempted to bridge the gap between Uncommons and Rares. Some Rares from before became EUC after the update, that's how close that gap is now. So even if it still doesn't feel great, the more we try to get rid of the "there is a huge spacing between EUC and R" mindset, the better. I wish we knew the exact numbers again, we definitely used to and it would help so much with figuring out how to make our guides.
-
SolarSonnet - Posts: 1691
- Joined: Mon Oct 19, 2015 7:34 am
- My pets
- My items
- My wishlist
- My gallery
- My scenes
- My dressups
- Trade with me
Who is online
Users browsing this forum: No registered users and 8 guests